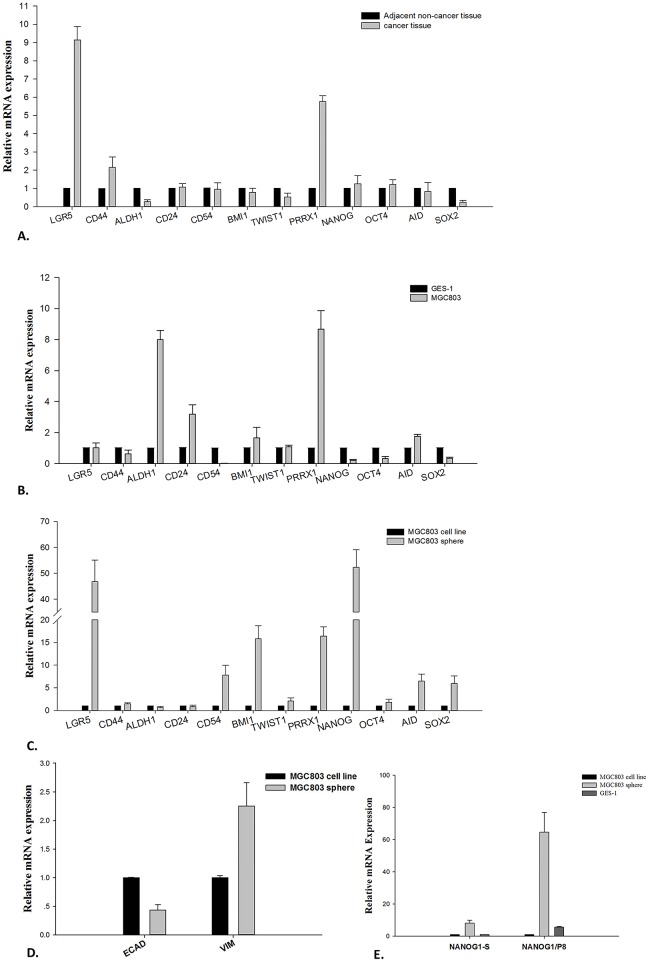
Fig 1. Detection of gene expression profiles by qPCR.
A. Gastric cancer tissues versus adjacent normal tissues. B. MGC803 (a poorly differentiated cancer cell line) adherent cells versus GES-1 (a gastric epithelial cell line) adherent cells. C. MGC803 sphere cells versus MGC803 adherent cells. D. Expression of E-cadherin and vimentin in sphere cells versus parental adherent cells. ECAD stands for E-cadherin; VIM stands for vimentin. E. Expression of NANOG1-S and NANOG1/P8 in sphere cells versus parental adherent cells. NANOG1-S stands for NANOG1-specific primers and NANOG1/P8 stands for NANOG1 and NANOGP8 shared primers.

