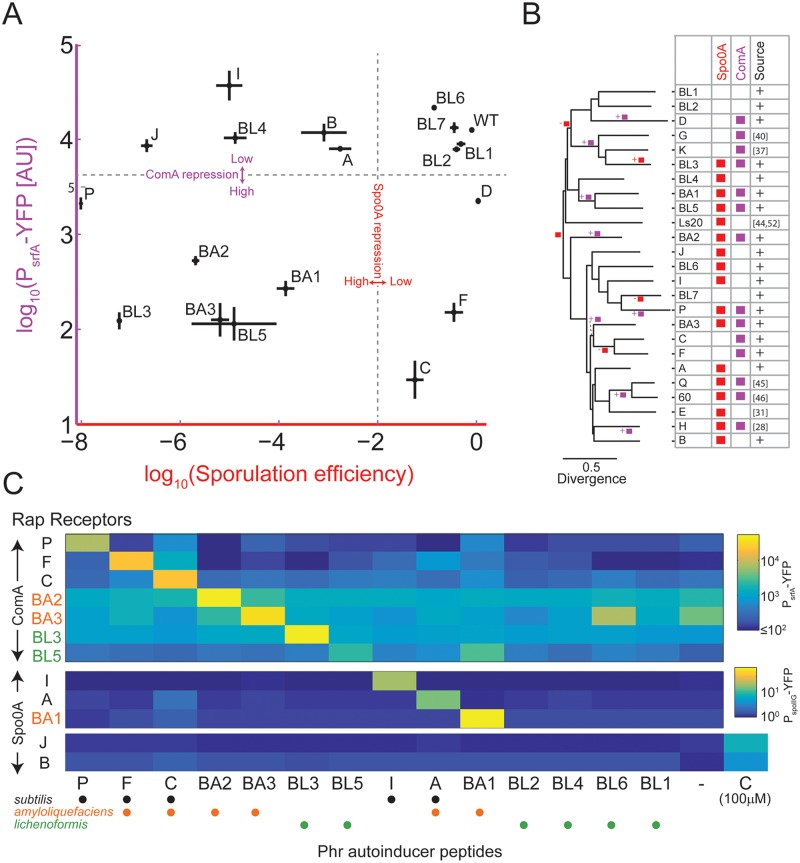
Fig 3. Target switching and autoinducer specificity of Rap-Phr pairs.
(A) The effect of overexpression of multiple Rap systems on sporulation efficiency (x-axis) and on PsrfA-YFP reporter expression (y-axis). Strains overexpressing rapBA1-3, rapBL1-7, and rapI, P, B, J, and D were constructed in a wild-type background, while strains overexpressing rapF and rapC were constructed in a ΔrapFphrF; ΔrapCphrC background. The effects of RapA were measured using a ΔphrA deletion mutant. To control for the indirect effect of the spo0A pathway on ComA activity, PsrfA-YFP expression was measured in a background deleted for spo0A. See also S7 Fig. (B) Phylogenetic inference of Rap target evolution. Shown is the phylogenetic tree of all experimentally characterized Rap proteins. Shown on the right of the tree are the known effects of each of these Rap variants on Spo0A (red) or ComA (purple) activities. The source column is marked with a “+” sign if this interaction was identified or verified in this work, while a reference number is given otherwise. The GLOOME software [55] gain/loss parsimony results are marked on the tree. The root is marked by a red square to reflect the original Spo0A activity control. A branch marked with a square and “+” or “-”signs next to it indicates that the analysis established that a regulatory activity was gained or lost, correspondingly, along the specific branch. (C) Specificity of Rap-Phr systems. Yellow fluorescent protein (YFP) expression from a PsrfA-YFP (top) or a PspoIIG-YFP (bottom) reporter in strains overexpressing the indicated rap genes (y-axis) and grown under appropriate conditions together with 10 μM of the indicated peptide phr autoinducer (x-axis, see S1 Table for peptide sequences. “-”indicates no peptide). For the orphans RapB and RapJ, spoIIG promoter activity was assayed also for the addition of 100 μM of phrC for comparison with previous works. Dots below each putative peptide indicate whether it is produced by isolates of the B. subtilis (black), amyloliquefaciens (orange), or lichenoformis (purple) species. Raw data for panels A and C are given in S5 Data.

