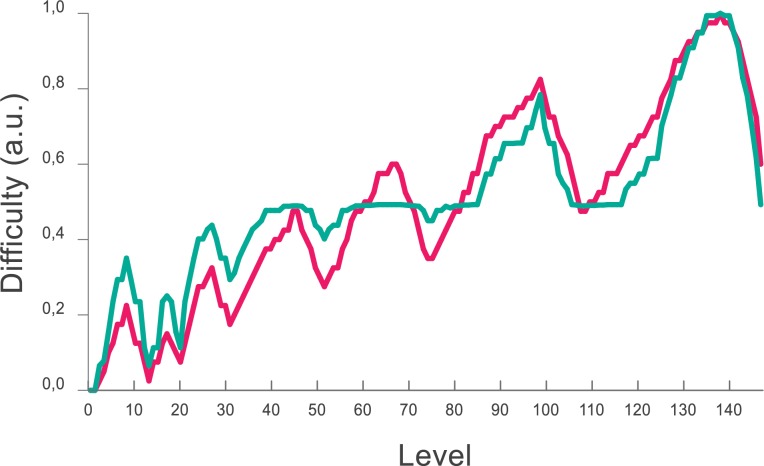
Fig 2. Difficulty as a function of the level.
To generate an engaging experience, difficulty progresses as a series of increases and decreases. The difficulty in each level is shown according to a prediction based on the number of mental computations and memory load required by each problem (magenta). This correlates as expected with the measured RTs (green) after the experiment.

