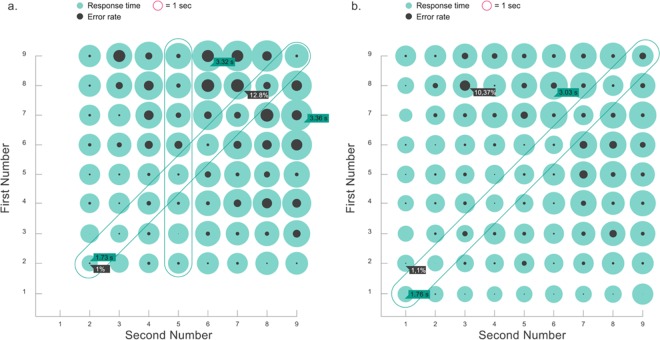
Fig 7. Average response times (green) and error rates (grey) for 1-digit multiplications and additions (Fig 7A and 7B, respectively).
The diameters of each circle represent the magnitude of the measure. Larger numbers are more difficult, resulting in longer RTs and larger error rates, with the exception of the equal-numbers multiplications and additions, and multiplications by 5, highlighted in the figure.

