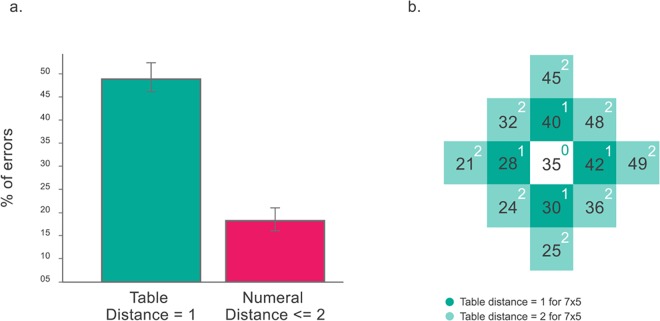
Fig 8.
(a) Most errors correspond to one of the four possibilities given by a table distance = 1. For a fair comparison against a possibility with four different results, we also plot the errors corresponding to numerical distance < = 2. Inter-subjects SEs are also shown. (b) Figure explaining the concept of table distance for the 7x5 problem. The numbers in dark green are separated by a table distance of 1 and in light green by 2.

