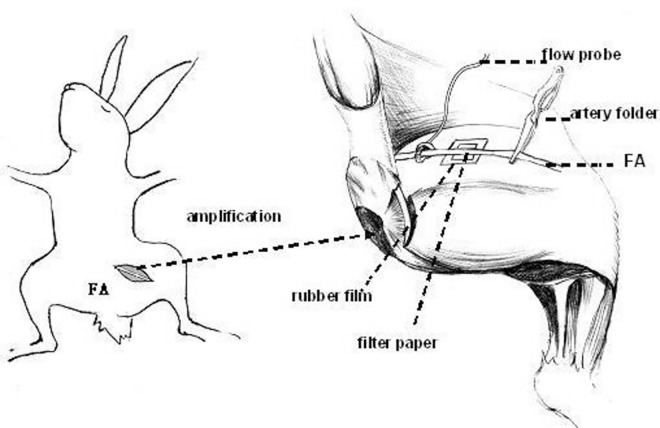
Fig 1. Schematic diagram of the femoral artery thrombosis model.
Pulsed Doppler flowmetry was used to continuously monitor arterial blood flow. When a thrombus had formed, the pulse Doppler blood flow meter displayed values < 0.05 l/min, while the two-dimensional and color Doppler ultrasound confirmed the presence of an occlusive thrombus.

