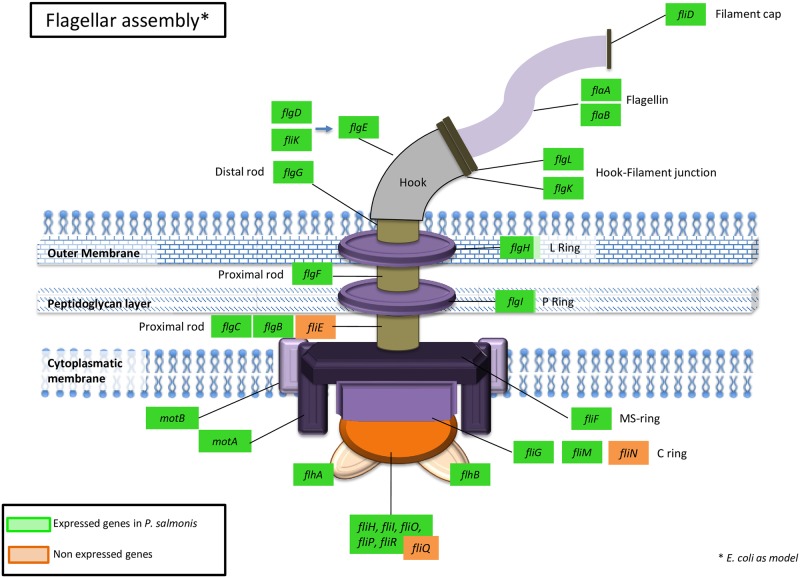
Fig 2. Representative genes associated with the flagella in the transcriptome.
The image shows the set of genes associated with the flagellar structure that are expressed by P. salmonis in all conditions tested. The green square represents genes expressed in the different media, whereas the orange square represents genes that did not show expression., in the different grown conditions analyzed.

