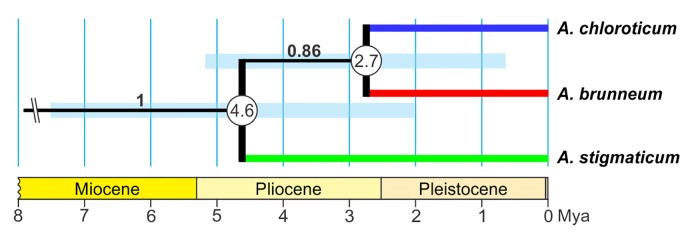
Fig 4. Divergence times for Aylacostoma species obtained from BEAST analysis of the 12S mt rRNA dataset.
Numbers within circles indicate divergence times in millions of years. Bars at each node represent 95% confidence intervals. Posterior probabilities are shown on branches. Time axis (in millions of years) adapted from the International Chronostratigraphic Chart [56].

