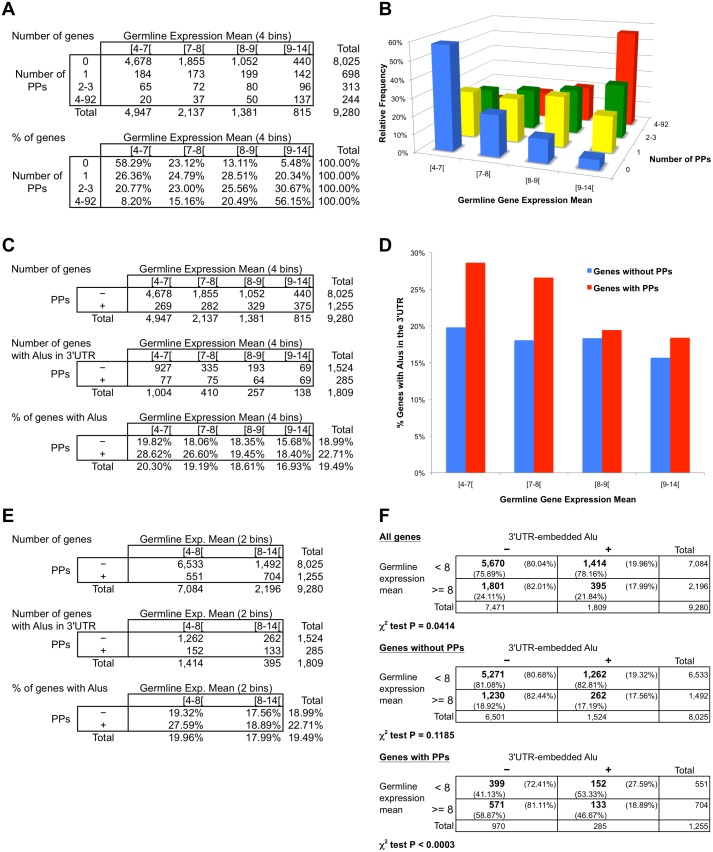
Fig 5. Gene expression and overrepresentation of 3’UTR-embedded Alu elements in PP parent genes.
(A) The top table shows number of genes grouped by their germline gene expression mean and their number of generated PPs (4x4 groups); total numbers of genes are also displayed. The bottom table shows the corresponding percentage of genes in each row (groups by number of PPs) of the top table. (B) Bar graph representing the data from the bottom table of A. (C) Counts of genes grouped by their germline gene expression mean (4 bins) and presence or absence of generated PPs (+ and–, respectively). Total numbers of genes are also indicated. The top table displays the overall dataset; the middle table shows only genes with 3’UTR-embedded Alus; the bottom table presents the percentages of genes with these Alus. (D) Bar graph representing the data from the bottom table of C. (E) Same tables as in C but grouping genes into 2 bins of germline gene expression mean. (F) Contingence tables testing overrepresentation of Alu elements inside 3’UTRs of lowly expressed genes (germline gene expression mean lower than 8) respect to highly expressed genes (germline gene expression mean higher or equal to 8). The top table displays the overall gene set; the middle table shows only the genes without associated PPs; the bottom table presents only the genes with PPs. Plus and minus signs above the tables indicate presence or absence, respectively, of Alus inside the 3’UTR(s) of a gene. Numbers in bold are gene counts; total number of genes are also displayed in the right column and the bottom row for each table. Percentages with respect to each total are also shown. P-values of the χ2 test are indicated below each corresponding table.

