
Figure 1. Features of i3C performed in HUVECs.
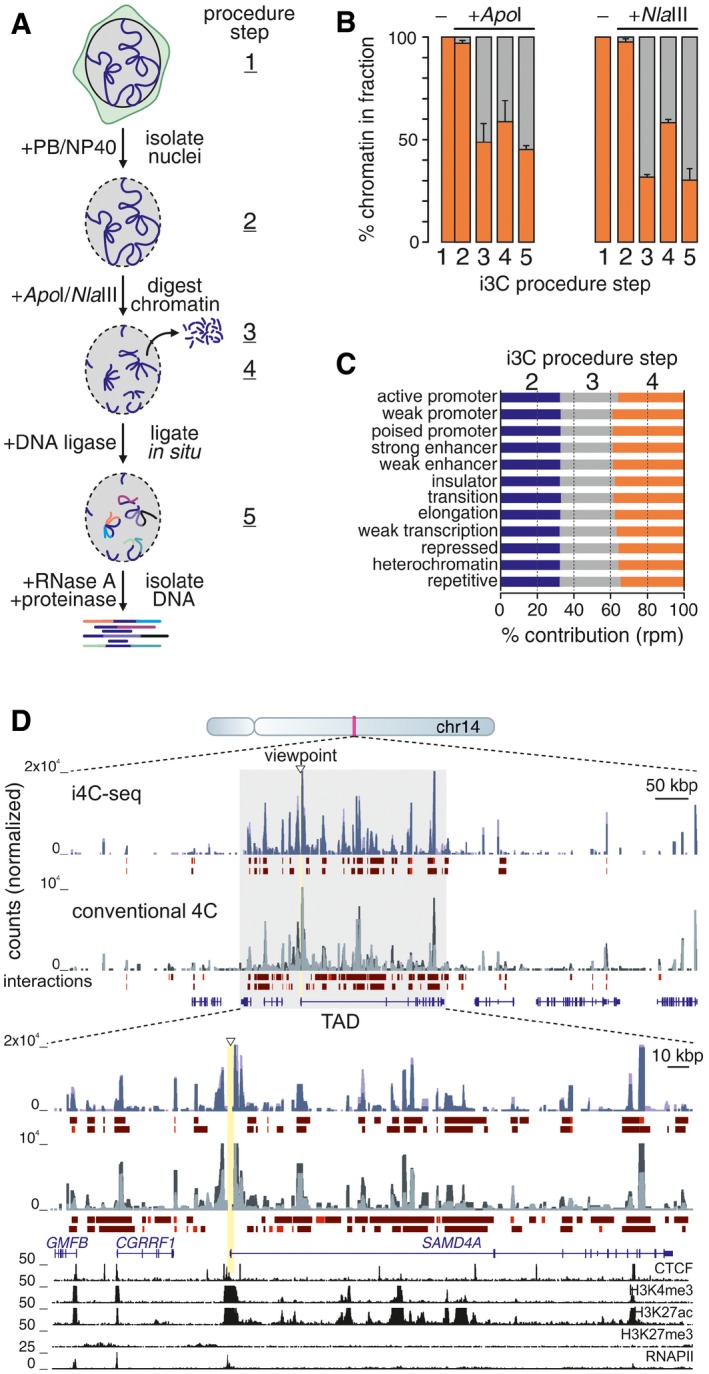
- Overview of the i3C protocol. Living cells are harvested in a close‐to‐physiological buffer (PB; step 1); intact nuclei isolated by mild NP‐40 treatment (step 2); chromatin digested using ApoI or NlaIII, nuclei spun to release unattached chromatin (step 3); and leave cut chromatin bound to the nuclear substructure (step 4). Then, ligation takes places in situ, and DNA is isolated (step 5).
- Percentage of total cell chromatin present at the different steps of the procedure (± SD; n = 2).
- Relative contribution of the different HUVEC ChromHMM features in each i3C fraction.
- i4C‐seq (blue shades) and conventional 4C (gray shades) were performed side by side in HUVECs, using ApoI and the SAMD4A TSS as a viewpoint (triangle); profiles from two replicates are overlaid. The browser view shows interactions in the ˜1 Mbp around SAMD4A. The zoom‐in shows interactions in the SAMD4A TAD (gray rectangle). Strong (red) and intermediate (brown) interactions called by fourSig, RefSeq gene models, and ENCODE ChIP‐seq data are shown below.