
Figure 4. 3D organization of a 2.8‐Mbp human locus analyzed by iT2C/conventional T2C.
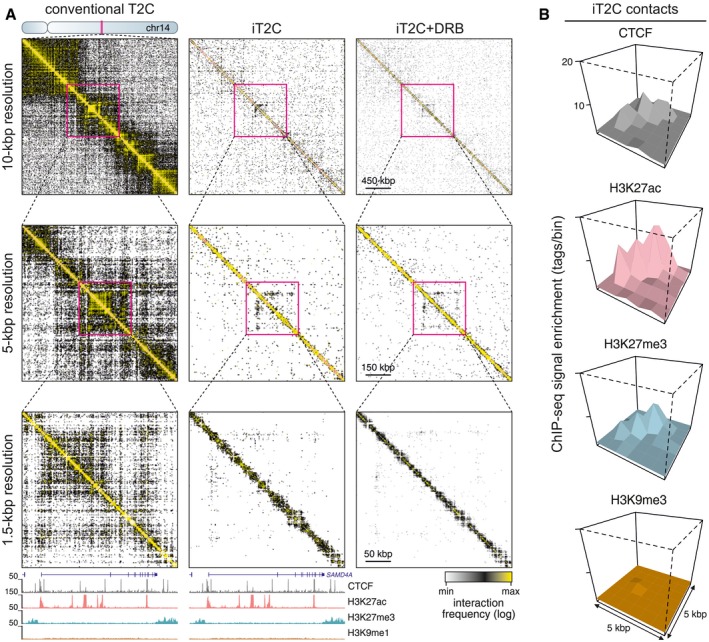
- Interaction maps from conventional T2C (left) and iT2C (middle, right) in the 2.8 Mbp around SAMD4A on chromosome 14. Magnifications show interactions at increasingly higher resolution. Bottom: HUVEC ENCODE ChIP‐seq data are aligned to interactions mapped at 1.5‐kbp resolution in the 250 kbp around SAMD4A.
- PE‐SCAN graphs (see de Wit et al, 2013) show the enrichment of iT2C interactions (± 5 kbp) for CTCF (gray), H3K27ac (pink), and H3K27me3 (blue), while H3K9me3 (brown) that is absent from this region serves as a control.