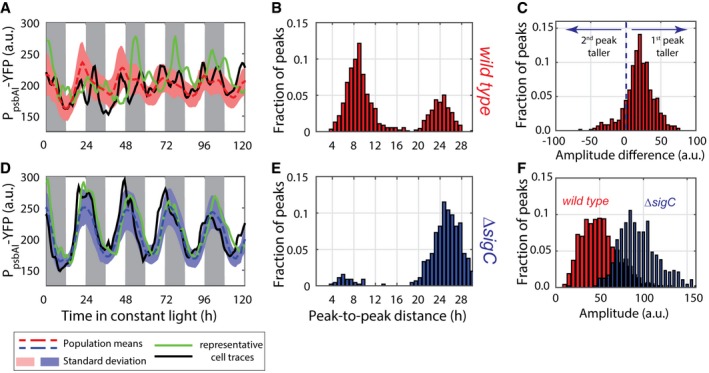
Figure 1. psbAI expression shows two peaks per circadian cycle.

- Time traces of PpsbAI‐YFP reporter grown under constant low light (ca. 15 μE m−2 s−1 cool white light). Individual lineages (black and green lines) show the existence of a second peak following the first (dusk timed) peak of expression. Owing to cell‐to‐cell desynchronisation, this second peak is often hidden when expression is measured at the population level (dashed red line, with pink shades representing one standard deviation from the mean). The white and grey shades represent subjective day and subjective night, respectively. 1,319 cells from 10 movies (with up to 419 cells per time point) were collected.
- Measure of the distance between the first peak in each circadian cycle and the following peak. The majority of peak pairs occur in the same circadian cycle, with a mean peak‐to‐peak distance of ca. 9 h within this subpopulation.
- Distribution of the difference in peak amplitudes between the first and second peaks in a circadian cycle (for cycles where a double peak is present). The second peak is, on average, smaller in amplitude than the first peak.
- Neither single‐cell traces nor a population average of psbAI expression shows a double peak in a sigC deletion strain (lines and shades as in A). 1,088 cells from eight movies (with up to 419 cells per time point) were collected.
- Measure of the distance between the first peak in each circadian cycle and the following peak shows that the vast majority of lineages have one peak of expression per day.
- Distribution of peak amplitudes in wild‐type and sigC deletion strains shows that sigC negatively regulates psbAI expression.
Source data are available online for this figure.
