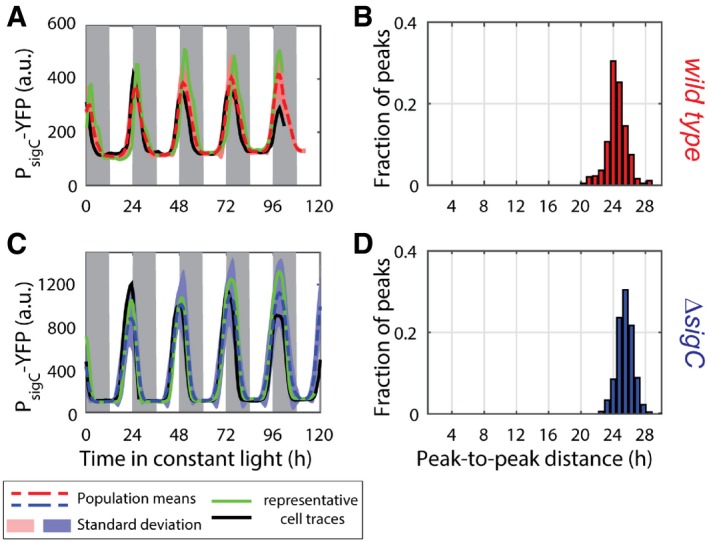
Figure 3. sigC single‐cell traces do not show a double peak, but show that sigC is negatively auto‐regulated.

- Neither single‐cell traces nor a population average of a reporter for sigC, PsigC‐YFP, shows a double peak of expression. 664 cells from nine movies (with up to 213 cells per time point) were collected.
- Measure of the distance between the first peak in each circadian cycle and the following peak confirms that there is only one peak per circadian cycle.
- The amplitude in sigC expression is raised by 3.5‐fold in a sigC knock‐out strain, consistent with a sigC‐negative auto‐regulation. 1,084 cells from six movies (with up to 352 cells per time point) were collected.
- Measurement of the distance between the first peak in each circadian cycle and the next peak confirms that there is only one peak per circadian cycle.
