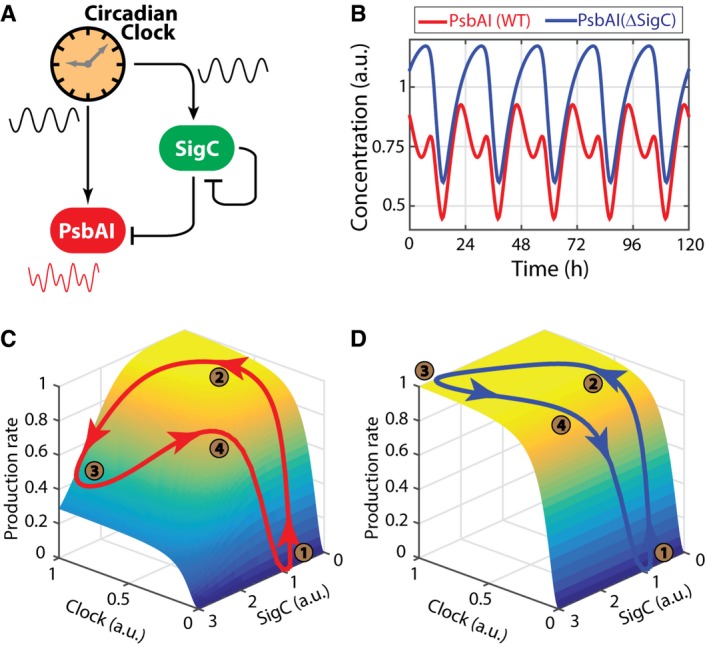
Schematics of the proposed regulatory network. The circadian clock regulates both PsbAI and SigC, and SigC represses both PsbAI and itself. Since the circadian clock regulates PsbAI through two separate branches of opposite signs, one of which is mediated by an intermediate gene, this network contains an incoherent feedforward loop motif.
Numerical simulations of the wild‐type network show double peaks of expression (red line), and numerical simulations of a SigC knock‐out model (in which the terms representing the regulation of PsbAI by SigC are set to zero) show only single‐peaked oscillations (blue line).
The trajectory of the normalised production rate of PsbAI in the wild‐type (red line) simulation shows the dependence of the double peak on the states of the clock and SigC. The surface represents the two‐input production rate function. When the levels of both the clock and SigC are low, the production rate is also low (time point 1, brown circle). As the state of the clock rises, the production rate follows and reaches a plateau (time point 2, which corresponds to the main peak of PsbAI in panel B). However, SigC also rises, crossing a threshold and overcoming the clock, thus imposing a trough in the production rate (time point 3). Later, SigC drops low enough to relieve its negative regulatory activity, and the production rate reaches a second peak (time point 4).
In the SigC deletion simulation (the terms representing the regulation of PsbAI by SigC are set to zero, but SigC expression is tracked for reference), the production rate of PsbAI only responds to the clock, which is a single‐peak oscillation, and so the trajectory of the production rate (blue line) only has a single peak itself (the plateau where time points 2, 3 and 4 lie).

