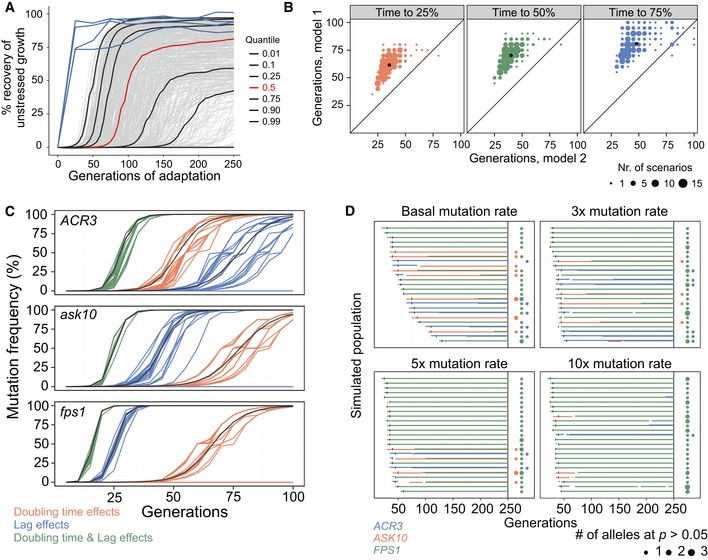
A, BSimulating populations (n = 500) with different mutation parameters adapting to arsenic, in an individual cell‐based model. Each cell has a cell division time (population doubling time) and a time to the first cell division (lag). Cell division times were recorded every 5th cell division, and population means were expressed as the fraction of founder growth w/o arsenic recovered. (A) Mutations affect only cell division time. Grey lines = 500 adapting populations. Black lines = quantiles corresponding to the fastest 1, 10, 25, 75, 90 and 99% of populations. Red line = median population. Blue line = empirical arsenic populations, P1–P4. (B) Contrasting simulations with mutations only affecting cell division time (model 1, M1, y‐axis) or both cell division time and the time to the first cell division with the same effect size and direction (model 2, M2, x‐axis). The number of cell divisions required to recover 25% (left panel), 50% (middle panel) and 75% (right panel) of founder growth w/o arsenic is shown. The 227 fastest scenarios, with 75% recovery in ≤ 100 cell divisions, are displayed. Dot size = number of populations. Black dot = median population.

