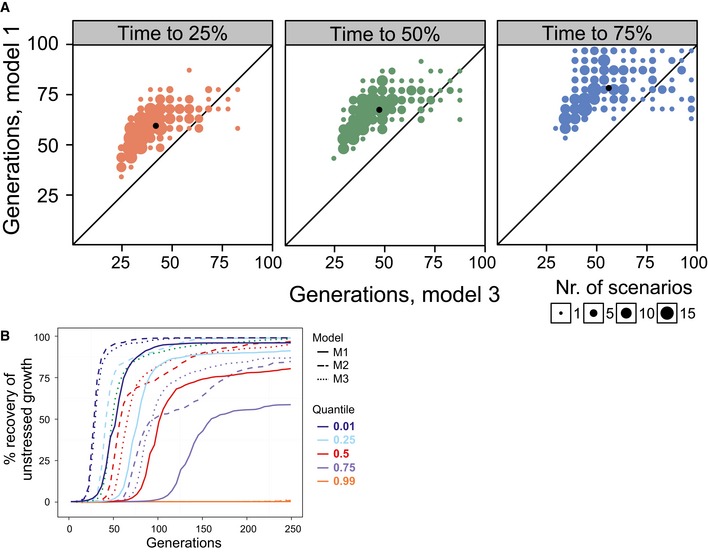
A, BSimulated populations (n = 500) adapting to As(III) in a model mimicking the experimental set‐up. Each population has a distinct set of mutation parameters driving intermediate to fast adaptation, and each cell has a genotype–phenotype map where mutations affect cell division time (doubling time), time to the first cell division (growth lag), or both. Phenotypes were extracted every 5th cell division, population means were estimated and expressed as the degree to which the population had recovered unstressed performance (doubling time), that is 0 and 100% correspond to WT performance in presence and absence of arsenic respectively. (A) Contrasting models in which mutations affect only rate (M1, y‐axis) and both rate and lag with random strength and direction (M3, x‐axis). Number of cell divisions to recover 25% (left panel), 50% (middle panel) and 75% (right panel) of unstressed doubling time is shown. Only the 204 fastest scenarios, recovering 75% of unstressed performance in ≤ 100 cell divisions, are displayed. Dot size = number of populations in that position. Black dot = median population. (B) Visual comparison of populations adapting to arsenic in models where mutations affect only rate (M1, full lines), both rate and lag with similar effect size and direction (M2, dashed lines) and both rate and lag, but with random effect size and direction (M3, dotted lines). Quantiles corresponding to the fastest adapting 1, 25, 50, 75 and 99% of populations are shown.

