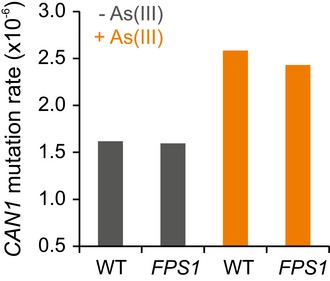
Figure EV4. Mutation rates are near basal at CAN1 during As(III) exposure.

Loss‐of‐function mutation rate at the CAN1 locus, measured by fluctuation assay, in founder (WT) and As(III) adapted (FPS1) cells, with and without As(III) exposure. y‐axis = the CAN1 loss‐of function mutation rate per CAN1 locus and cell division.Source data are available online for this figure.
