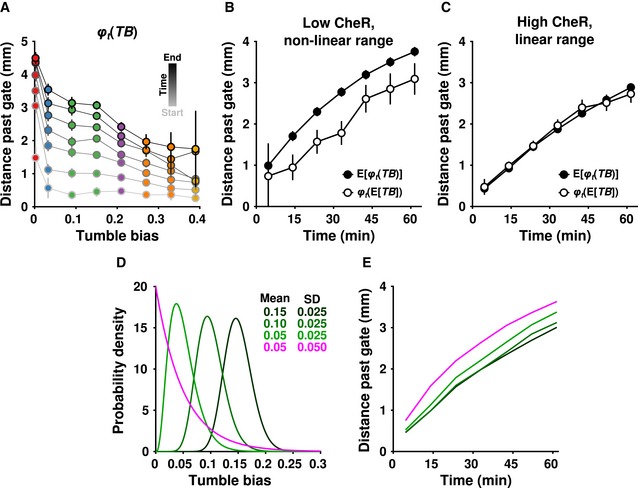
Figure 4. Non‐genetic heterogeneity strongly affects mean population performance when performance is a convex function of phenotype.

-
AData from the 100 μM and 10 μM IPTG experiments were combined to produce a map from phenotype (tumble bias, TB) to performance (distance past the gate, φ t(TB)). The lowest tumble bias point is 0.0025.
-
B, CThe mean performance of the population (closed circles, same as in Fig 3F) and the performance of the mean phenotype (open circles) over time for cells induced with 10 μM (B) or 100 μM (C) IPTG. The mean tumble bias ± 2 standard errors was 0.044 ± 0.0005 for the low‐CheR population (B), and 0.175 ± 0.0006 for the high‐CheR population (C). In each case, the performance of the mean phenotype was calculated by averaging the performance of cells within 0.01 of the mean tumble bias. In all cases, error bars indicate ± two times the standard error of the mean.
-
D, EPredictions of performance for hypothetical populations. (D) A series of hypothetical tumble bias distributions were generated using a gamma function with parameters [k; θ] of [36; 4.17 × 10⁻³], [16; 6.25 × 10⁻³], [4; 0.0125] (dark to light green), and [1; 0.05] (magenta). The parameters for the green curves were chosen to have decreasing means and identical standard deviations (SDs). The light green and magenta distributions were chosen to have the same mean and different SDs. (E) φ t(TB) from (A) was interpolated and used to generate predicted performance curves for the tumble bias distributions in (D).
