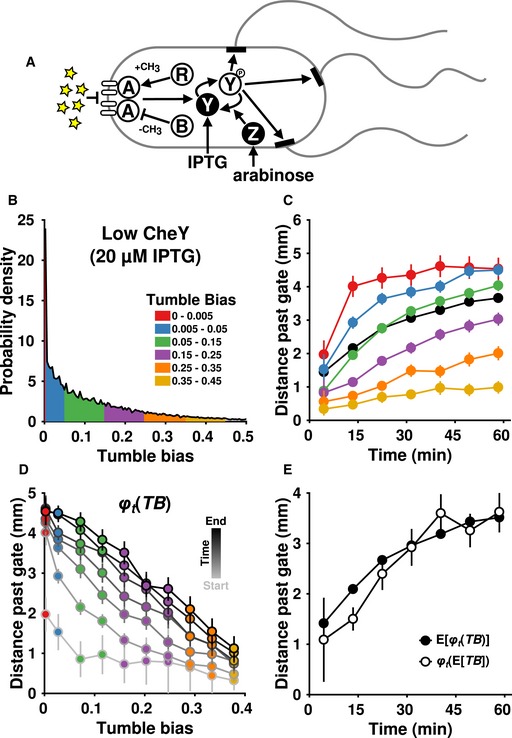
Figure EV5. Performance depends on tumble bias even when tumble bias is modified independently from adaptation time.

- Schematic of the dual‐inducible CheY/CheZ strain. Symbols are same as in Fig 3A.
- Tumble bias distribution of the dual‐inducible strain induced with 20 μM IPTG and 0.0001% arabinose.
- The performance of the dual‐inducible strain. Black indicates the average position of the entire population.
- Performance (distance past the gate) as a function of phenotype (tumble bias, TB) for every pass through the microfluidics chamber was used to create the function φ t(TB). The lowest tumble bias point is 0.0025.
- The mean performance of the population (closed circles) and the performance of the mean phenotype (open circles) over time. The performance of the mean phenotype was defined as the average performance of cells having a tumble bias within 0.01 of the population mean tumble bias (0.13 ± 0.002). The data are from two experiments totaling 17,400 cells.
