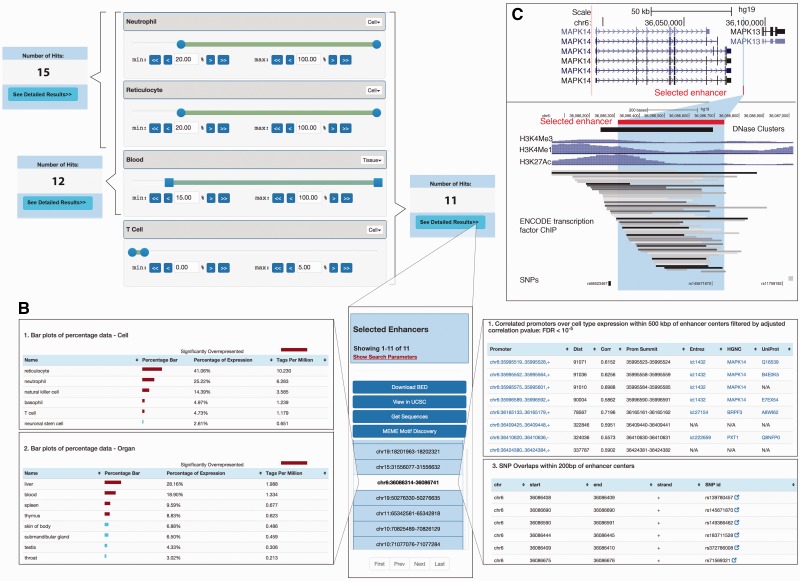
Figure 2.
Example of selection of tissue-specific enhancers. The selection of genes, proteins or miRNAs based on expression or abundance works similarly. (A) Selection of cell/tissue-specific enhancers based on sliders: Sliders for neutrophils, reticulocytes and T cells as well as whole blood are shown (out of a total of 69 cell + 41 tissue sliders, where slides that are not shown are set to defaults = no constraints). The number of selected enhancers obtained from moving sliders is shown in blue boxes. Selecting a minimum expression contribution of 20% from neutrophils and reticulocytes results in 15 enhancers. If also requiring ≥15% expression from blood, the number of enhancers decreases to 12. Sliders also allow for negative selection, allowing at maximum only a certain amount of expression from a cell type: this is done by the right slider handle, exemplified by permitting at maximum 5% T-cell expression. The 11 enhancers resulting from the overall selection are shown in panel B. (B) Detailed expression of selected enhancers. Middle: Overview of the enhancers selected in panel A. The highlighted enhancer serves as an example for data in left and right panels. Left: Detailed expression data across all FANTOM5 samples for each enhancer for tissues/organs and primary cells. Right: SNP overlap and predicted promoter–enhancer associations of selected enhancers. Note that not all data present in the web tool is shown. (C) UCSC browser views of the enhancer region highlighted in panels B. Upper panel shows the larger gene landscape, including the MAPK14 gene linked to the enhancer highlighted in panel B. Lower panel shows a zoom-in.

