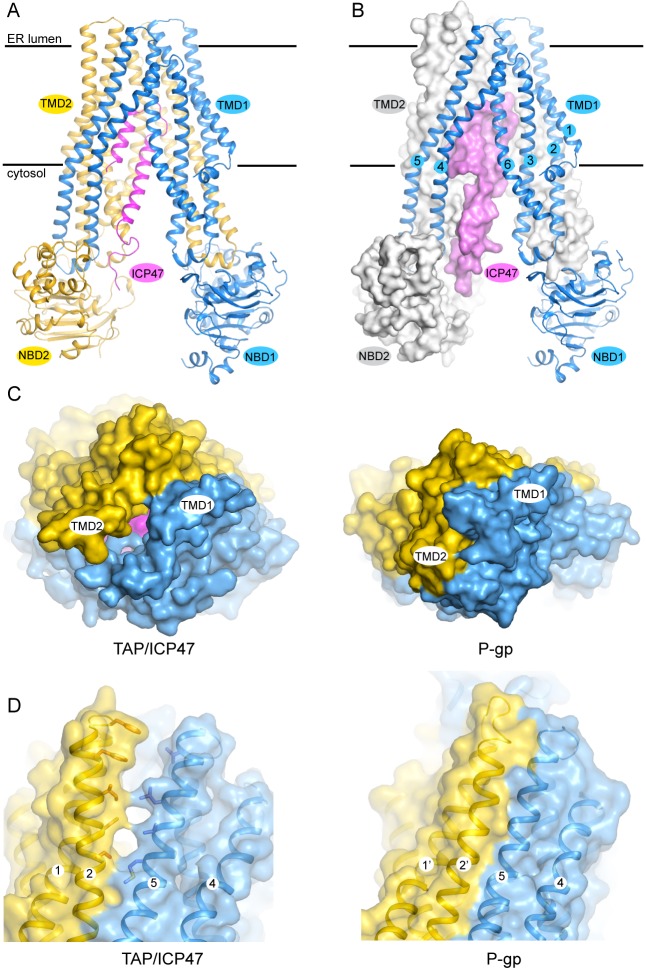
Figure 2. The structure of TAP trapped by ICP47.
(A) Ribbon representation of the TAP/ICP47 complex. Color code: TAP1 (blue), TAP2 (yellow), ICP47 (magenta) (B) The domain-swapped architecture: TAP1 is shown in ribbon representation, TAP2 and ICP47 are shown as surfaces. TAP1 TM helices are labelled. (C) The open ER luminal gate viewed along the membrane normal from the ER side (left). The closed extracellular gate of P-gp is also shown for comparison (right). (D) The lateral opening to the membrane bilayer at the ER luminal side (left). The equivalent region in P-gp is also shown for comparison (right).

