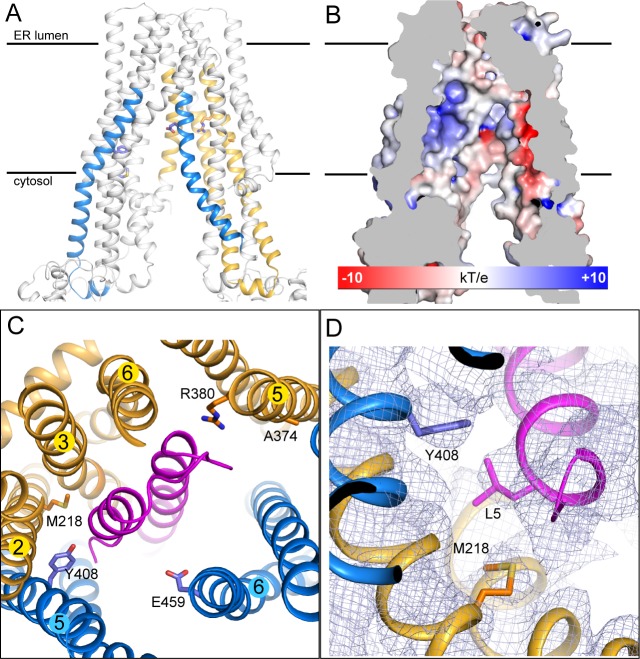
Figure 3. The substrate-binding site.
(A) Biochemically identified substrate-binding regions: TAP1 375–420 and 453–487 (blue), TAP2 301–389 and 414–433 (gold). The five residues previously suggested to interact with the substrate (TAP1 Y408, E459 and TAP2 M218, A374, R380) are shown in stick model. (B) The electrostatic potential surface of the substrate-binding cavity. The electrostatic potential was calculated assuming pH 7 and a 0.15 M concentration of both (+1) and (−1) ions. Isocontour levels ranging from −10 to 10kT/e are colored from red to blue. (C) The helical hairpin of ICP47 (purple) plugs into the substrate-binding site. (D) The N-terminal region of ICP47 packs against Y408 of TAP1 and M218 of TAP2. For clarity, only side chains of TAP1 408, TAP2 M218, and ICP47 L5 are shown. The blue mesh shows the B-factor sharpened cryo-EM reconstruction.

