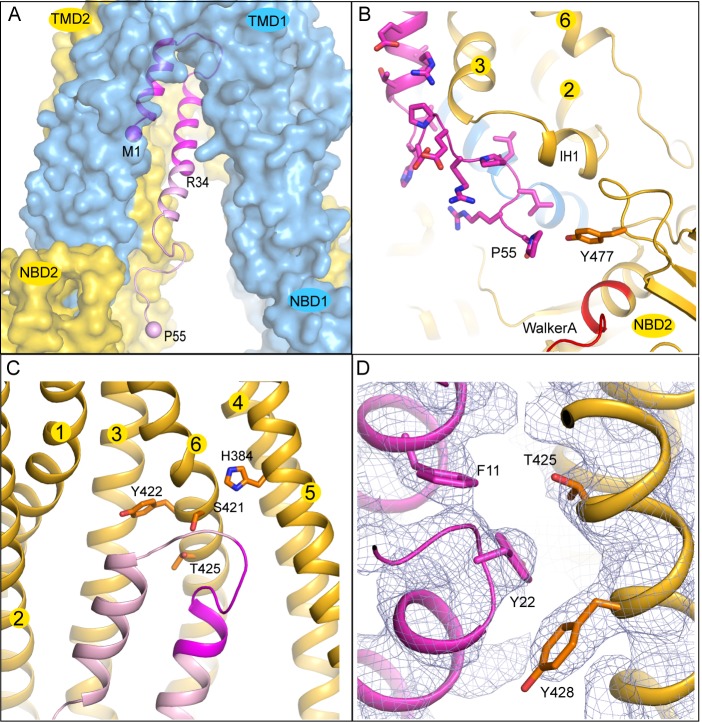
Figure 4. The interface between TAP and ICP47.
(A) The first 34 residues of ICP47, highlighted in darker magenta, insert into the transmembrane pathway. R34, and the first and last residues of ICP47 resolved in the structure (M1, P55) are labeled. (B) ICP47 reaches into the TMD2/NBD2 interface near Y477. (C) Interactions between the ‘hot-spots’ in TAP shown in stick models and those of ICP47 (residues 18–25, highlighted in darker magenta). (D) Interactions between TAP2 T425 and ICP47 F11 and Y22. For clarity, only side chains of TAP2 T425 and Y428 and ICP47 F11 and Y22 are shown. The blue mesh shows the B-factor sharpened cryo-EM reconstruction.

