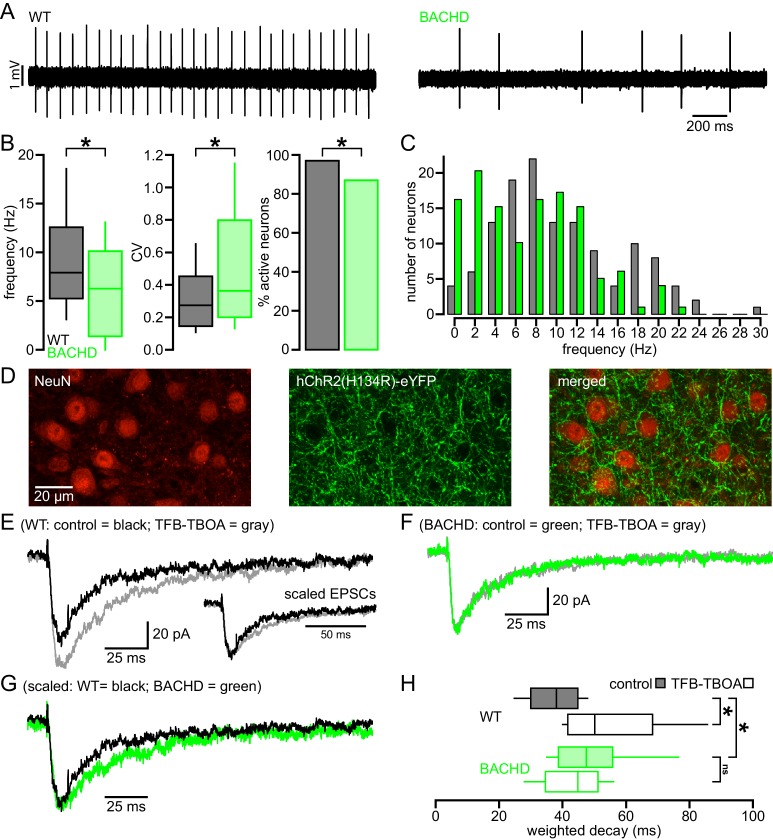
Figure 1. Abnormal intrinsic and synaptic properties of STN neurons in BACHD mice.
(A) Representative examples of autonomous STN activity recorded in the loose-seal, cell-attached configuration. The firing of the neuron from a WT mouse was of a higher frequency and regularity than the phenotypic neuron from a BACHD mouse. (B) Population data showing (left to right) that the frequency and regularity of firing, and the proportion of active neurons in BACHD mice were reduced relative to WT mice. (C) Histogram showing the distribution of autonomous firing frequencies of neurons in WT (gray) and BACHD (green) mice. (D) Confocal micrographs showing NeuN expressing STN neurons (red) and hChR2(H134R)-eYFP expressing cortico-STN axon terminals (green) in the STN. (E) Examples of optogenetically stimulated NMDAR EPSCs from a WT STN neuron before (black) and after (gray) inhibition of astrocytic glutamate uptake with 100 nM TFB-TBOA. Inset, the same EPSCs scaled to the same amplitude. (F) Examples of optogenetically stimulated NMDAR EPSCs from a BACHD STN neuron before (green) and after (gray) inhibition of astrocytic glutamate uptake with 100 nM TFB-TBOA. (G) WT (black, same as in E) and BACHD (green, same as in F) optogenetically stimulated NMDAR EPSCs overlaid and scaled to the same amplitude. (H) Boxplots of amplitude weighted decay show slowed decay kinetics of NMDAR EPSCs in BACHD STN neurons compared to WT, and that TFB-TBOA increased weighted decay in WT but not BACHD mice. *p < 0.05. ns, not significant. Data for panels B–C provided in Figure 1—source data 1; data for panel H provided in Figure 1—source data 2.
DOI: http://dx.doi.org/10.7554/eLife.21616.002

