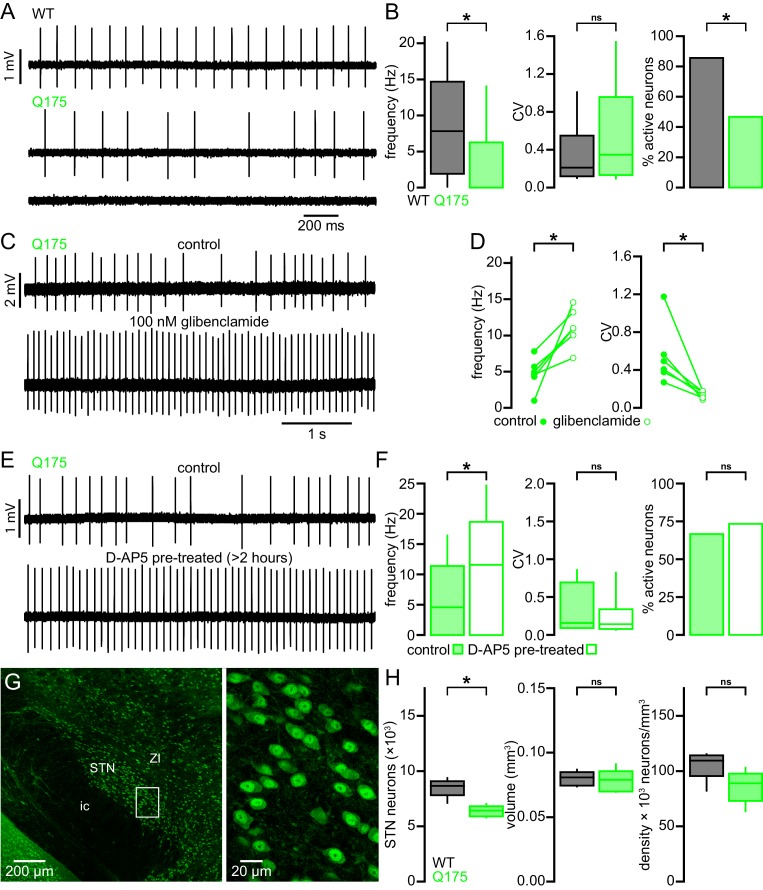
Figure 12. STN neurons exhibit similar dysfunction and degeneration in Q175 mice.
(A) Examples of impaired (middle, lower) autonomous firing of neurons from Q175 mice relative to WT (upper). (B) Population data showing STN neuron firing rate, CV, and proportion of active neurons from 6-month-old WT and Q175 mice. (C) Example showing the autonomous firing of a STN neuron from a Q175 mouse before (upper) and during (lower) inhibition of KATP channels with glibenclamide (100 nM). (D) Paired data confirming that inhibition of KATP channels in Q175 STN neurons consistently increased the rate (left) and regularity (right) of autonomous firing. (E) Examples of autonomous action potential generation from Q175 STN neurons from an untreated slice (upper) and a slice treated with 50 µM D-AP5 for 3–5 hr prior to recording (lower). (F) Population data showing STN neuron firing rate, CV, and the proportion of active cells in untreated and D-AP5 treated slices. The frequency of autonomous firing increased in D-AP5 treated slices. (G) Expression of NeuN in STN neurons in a Q175 mouse. (H) Population data showing STN neuron number (left), STN volume (center), and neuron density (right) in 12-month-old Q175 mice. The number of STN neurons was lower in Q175 mice compared to WT. *p < 0.05. ns, not significant. Data for panel B provided in Figure 12—source data 1; data for panel D provided in Figure 12—source data 2; data for panel F provided in Figure 12—source data 3; data for panel H provided in Figure 12—source data 4.
DOI: http://dx.doi.org/10.7554/eLife.21616.029

