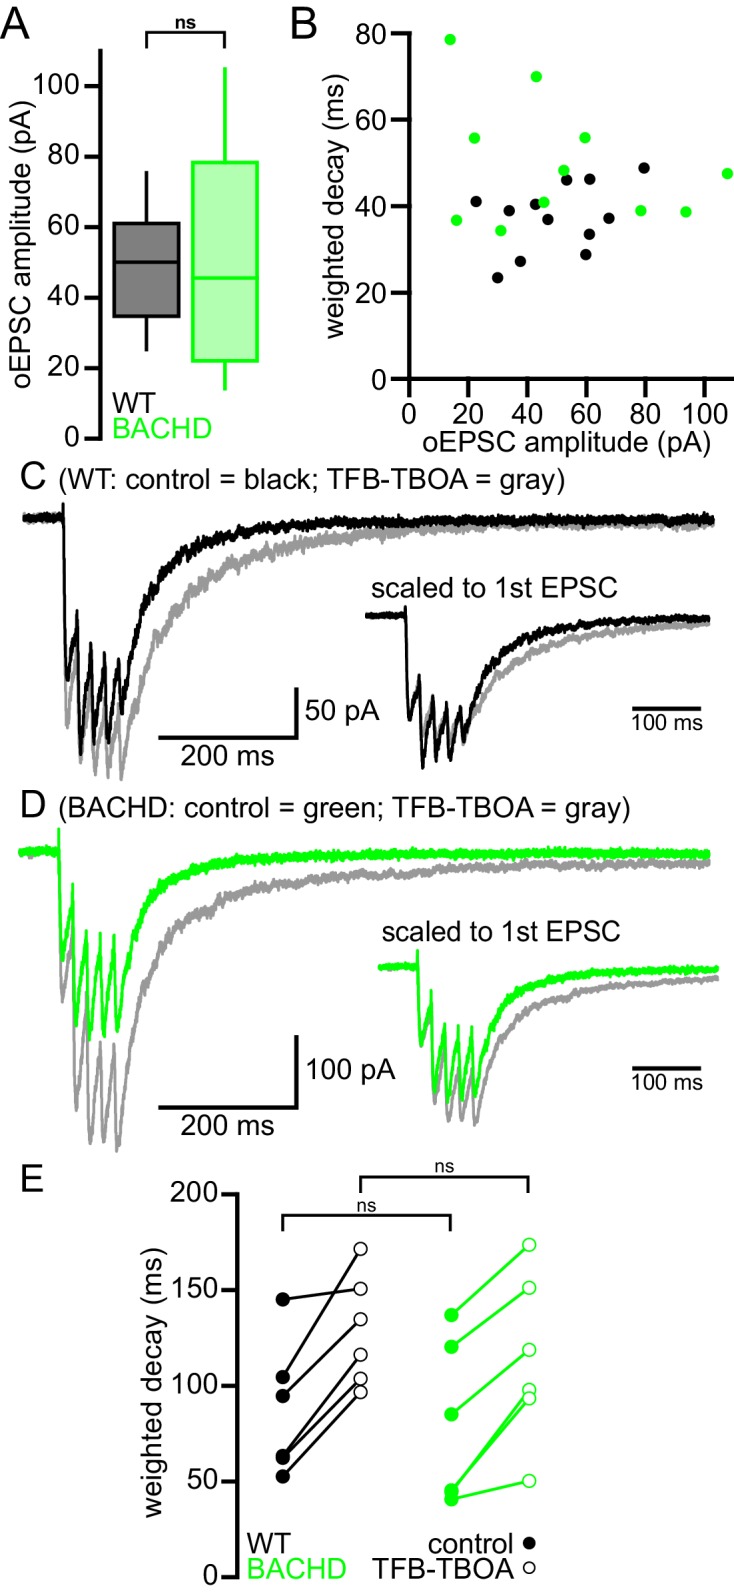
Figure 2. Cortico-STN EPSCs in WT and BACHD mice.

(A) Boxplot showing the distribution of single optogenetically stimulated cortico-STN NMDAR EPSC amplitudes in WT and BACHD mice. (B) Scatterplot showing NMDAR EPSC amplitude vs amplitude weighted decay time. There was no correlation between NMDAR EPSC amplitude and decay time in WT or BACHD mice. (C–D) Example of NMDAR EPSCs generated by 5 × 50 Hz optogenetic stimulation from a WT STN neuron (C) before (black) and after (gray) inhibition of astrocytic glutamate uptake with 100 nM TFB-TBOA and a BACHD STN neuron (D) before (green) and after (gray) TFB-TBOA application. (E) Line segment plots of amplitude weighted decay of compound NMDAR EPSCs before and following TFB-TBOA. The decays of compound NMDAR ESPCs were similar in WT and BACHD before TFB-TBOA application. In addition, inhibition of astrocytic glutamate uptake prolonged the decay of compound NMDAR ESPCs in all neurons tested. ns, not significant. Data for panels A–B provided in Figure 2—source data 1; data for panel E provided in Figure 2—source data 2.
DOI: http://dx.doi.org/10.7554/eLife.21616.005
