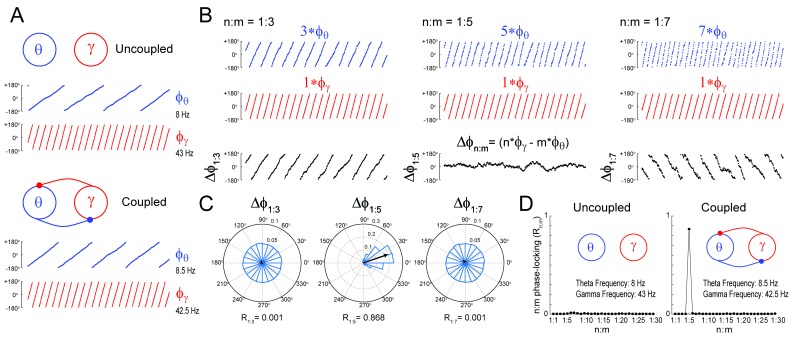
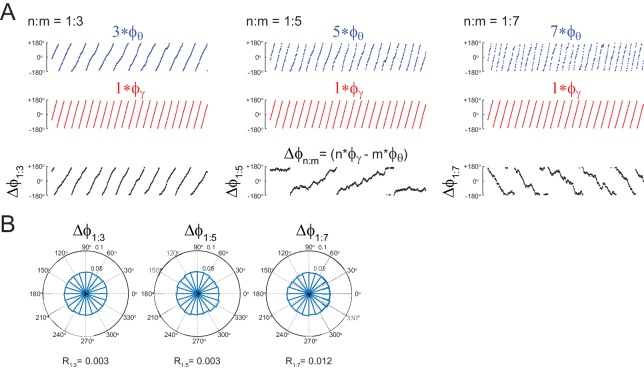
Figure 1. Measuring cross-frequency phase-phase coupling.
(A) Traces show 500 ms of the instantaneous phase time series of two Kuramoto oscillators (see Materials and methods). When uncoupled (top panels), the mean natural frequencies of the ‘theta’ and ‘gamma’ oscillator are 8 Hz (blue) and 43 Hz (red), respectively. When coupled (bottom panels), the oscillators have mean frequencies of 8.5 Hz and 42.5 Hz. (B) Top blue traces show the instantaneous phase of the coupled theta oscillator for the same period as in A but accelerated m times, where m = 3 (left), 5 (middle) and 7 (right). Middle red traces reproduce the instantaneous phase of the coupled gamma oscillator (i.e., n = 1). Bottom black traces show the instantaneous phase difference between gamma and accelerated theta phases (). Notice roughly constant only when theta is accelerated m = 5 times, which indicates 1:5 phase-locking. See Figure 1—figure supplement 1 for the uncoupled case. (C) distributions for the coupled case (epoch length = 100 s). Notice uniform distributions for n:m = 1:3 and 1:7, and a highly concentrated distribution for n:m = 1:5. The black arrow represents the mean resultant vector for each case (see Materials and methods). The length of this vector (Rn:m) measures the level of n:m phase-locking. See Figure 1—figure supplement 1 for the uncoupled case. (D) Phase-locking levels for a range of n:m ratios for the uncoupled (left) and coupled (right) oscillators (epoch length = 100 s).


