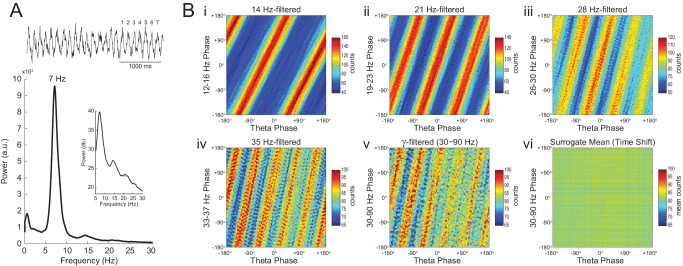
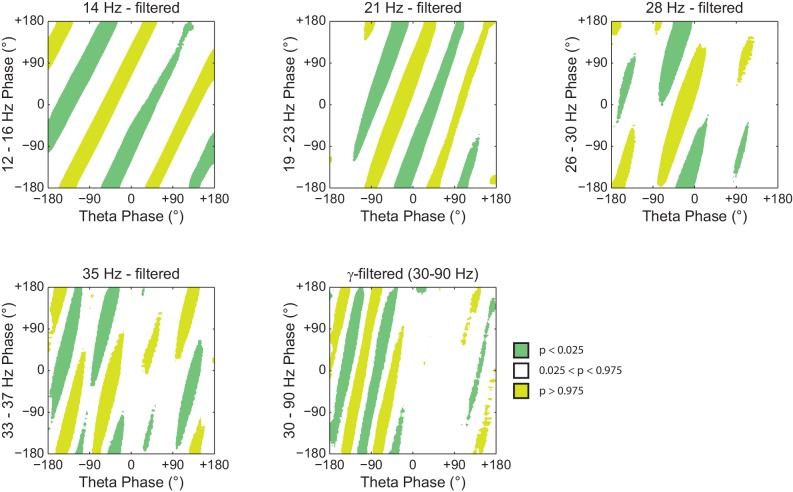
Figure 7. Phase–phase coupling between theta and gamma oscillations may be confounded by theta harmonics.
(A) Top, representative LFP epoch exhibiting prominent theta activity (~7 Hz) during REM sleep. Bottom, power spectral density. The inset shows power in dB scale. (B) Phase–phase plots for theta and LFP band-pass filtered at harmonic frequencies (14, 21, 28 and 35 Hz), computed using 20 min of concatenated REM sleep. Also shown are phase-phase plots for the conventional gamma band (30–90 Hz) and for the average over individual surrogate runs. Notice that the former mirrors the phase-phase plot of the fourth theta harmonics (35 Hz).


