Fig. 2.

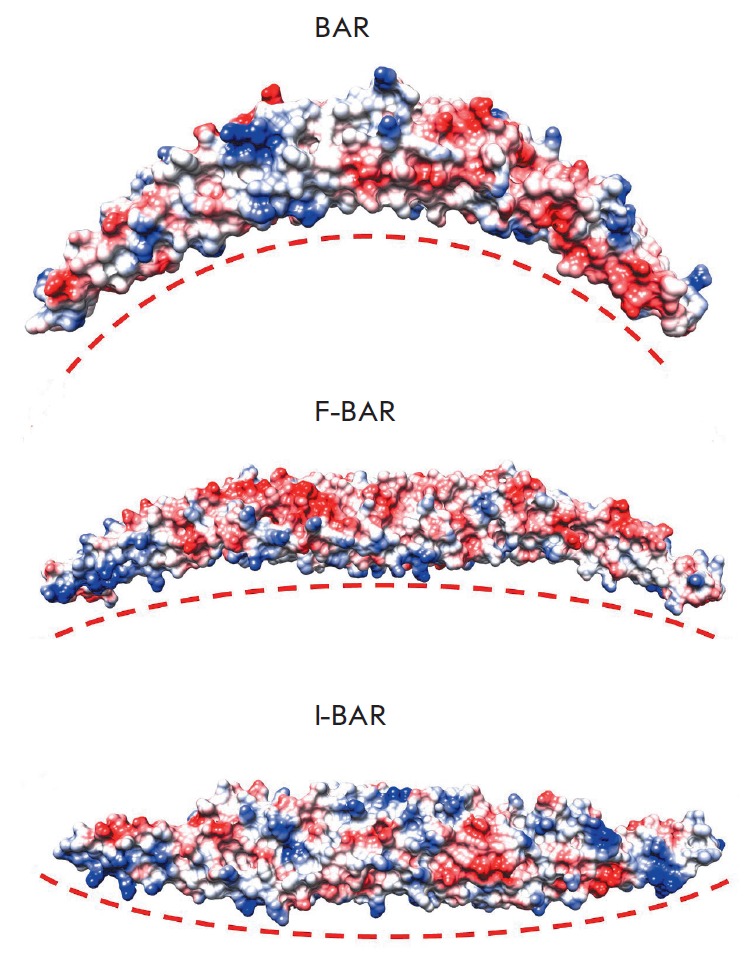
Membrane deformation by BAR domains. The electrostatic surface potentials of the domains are shown with blue as positive and red as negative; the membrane surface is depicted as a red dotted line.

Membrane deformation by BAR domains. The electrostatic surface potentials of the domains are shown with blue as positive and red as negative; the membrane surface is depicted as a red dotted line.