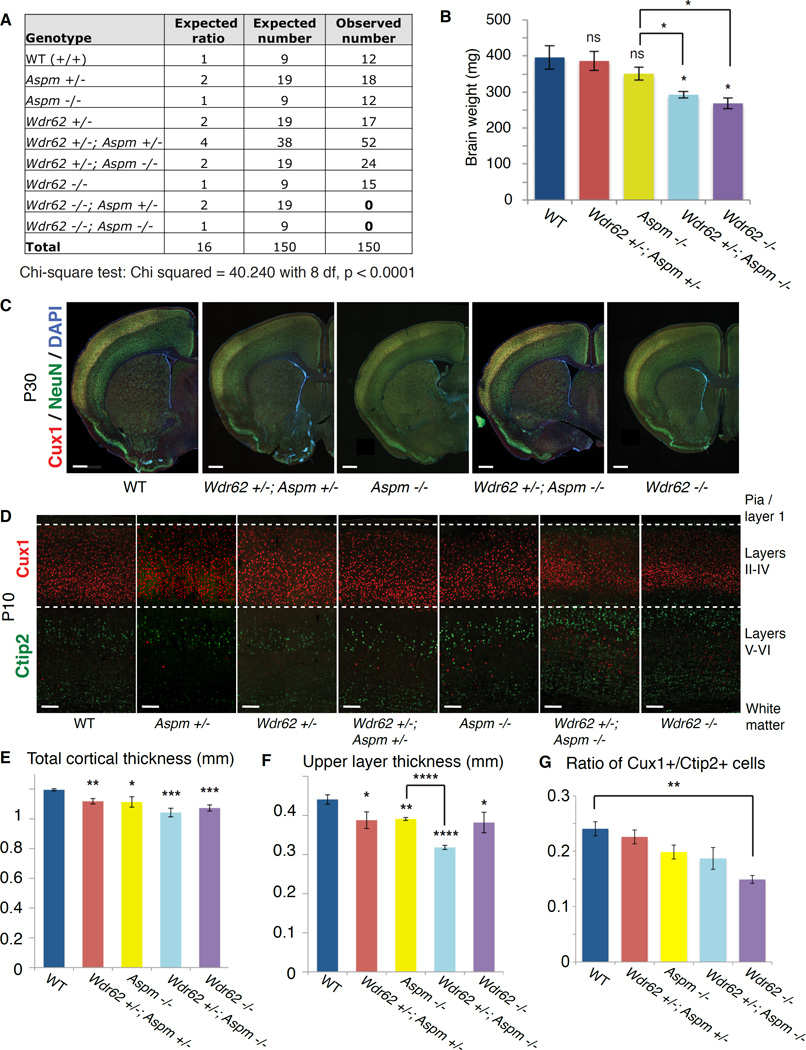
Figure 1. Wdr62 and Aspm interact genetically to control brain size in mice.
(A) Table of expected genotypic classes, Mendelian ratios, and predicted vs. observed numbers of progeny resulting from crossing Wdr62 +/−; Aspm +/− × Wdr62 +/−; Aspm +/− mice (trans het × trans het). Chi square test, p < 0.0001.
(B) Brain weights measured at P30 show a declining trend, with Wdr62 +/−; Aspm −/− and Wdr62 −/− mice showing a significant reduction in brain weight compared to WT and het controls, as well as Aspm −/− mice. Error bars indicate mean ± SEM. “ns” = not significant. * = p < 0.05.
(C) P30 coronal brain sections of various genotypes (from left to right: WT, Wdr62 +/−; Aspm +/−, Aspm −/−, Wdr62 +/−; Aspm −/− and Wdr62 −/−) stained for Cux1 (to label upper layers) and NeuN (to label all neurons) show a severe reduction in overall brain size in the Wdr62 +/−; Aspm −/− and the Wdr62 −/−. Scale bar = 500 µm.
(D) P10 coronal brain sections (from left to right: WT, Aspm +/−, Wdr62 +/−, Wdr62 +/−; Aspm +/−, Aspm −/−, Wdr62 +/−; Aspm −/− and Wdr62 −/−) showing primary somatosensory cortex (barrel region) stained for Cux1 and Ctip2 to label upper layers (II–IV) and lower layers (V–VI), respectively. Overall cortical thickness and upper layer thickness are severely reduced in the Wdr62 −/− brain and the Wdr62 +/−; Aspm −/− brain, with a mild reduction in thickness of the upper layers in the Aspm −/− cortex. Scale bar = 100 µm.
(E–G) * = p < 0.05, ** = p < 0.01, *** = p < 0.001, **** = p < 0.0001 and “ns” = not significant. Wdr62 +/− and Aspm +/− are not significantly different from WT (not shown). Error bars indicate mean ± SEM.
(E) Quantification of overall cortical thickness.
(F) Quantification of thickness of upper layers. Wdr62 +/− and Aspm +/− are not significantly different from WT in upper layer thickness (not shown).
(G) Quantification of ratio of Cux1+ cells to Ctip2+ cells. See also Supplemental Figure S1.

