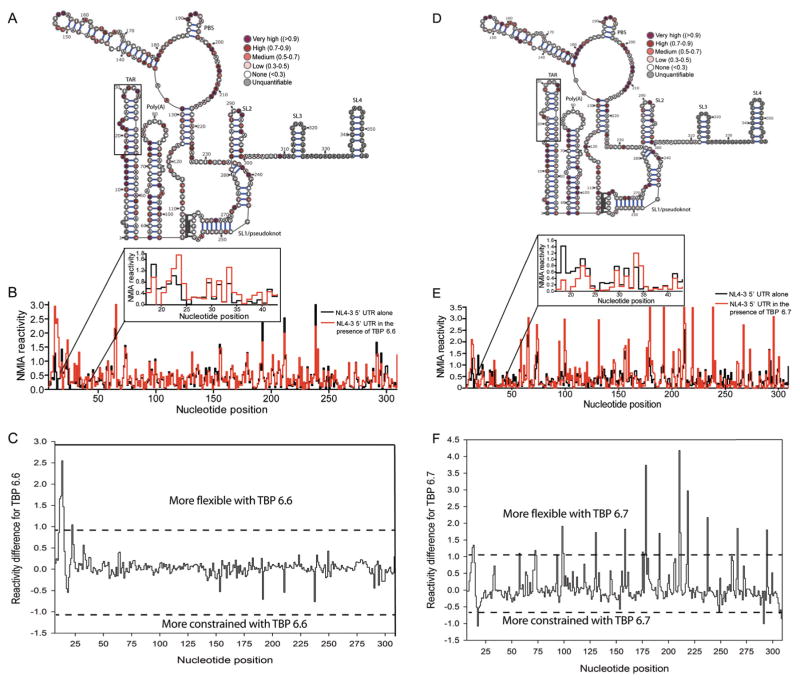
Figure 4.
SHAPE analysis of the monomeric NL4-3 5′-UTR RNA in the presence of an 8-fold excess of TBP 6.6 and TBP 6.7. (A) SHAPE reactivity profile of the 5′-UTR obtained in the presence of TBP 6.6, color-coded on the proposed pseudo-knot 5′-UTR monomeric structure (57, 58) (B) Step plot comparing the NMIA reactivity of the 5′-UTR in the presence (red) or absence (black) of TBP 6.6. (C) SHAPE difference profile showing conformational changes induced by TBP 6.6. (D) SHAPE reactivity profile of the 5′-UTR obtained in the presence of TBP 6.7, color-coded on the proposed pseudo-knot 5′-UTR monomeric structure. (E) Step plot comparing the NMIA reactivity of the 5′-UTR in the presence (red) or absence (black) of TBP 6.7. (F) SHAPE difference profile showing conformational changes induced by TBP 6.6. In (A), (B), (C), and (D), the boxed region corresponds to the test TAR region (nucleotides 17–43) used in the other binding selectivity assays.

