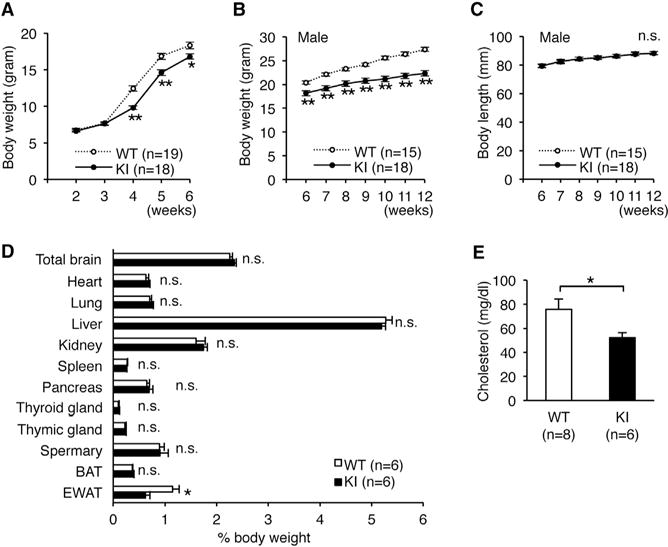
Figure 3. Edited CAPS1 KI Mice Exhibit Leanness.

(A) The body weights of wild-type (WT; ten male and nine female) and homozygous KI (KI; eight male and ten female) mice were followed from 2 to 6 weeks after birth. The difference in sex distribution was not significant between the two groups (p = 0.43, chi-square test).
(B and C) Body weight (B) and body length (C) of male littermates of the WT and KI mice were followed from 5 to 12 weeks after birth (see Figure S3).
(D) The weights of various organs were compared between male WT and KI mice. BAT, brown adipose tissue; EWAT, epididymal white adipose tissue.
(E) Plasma cholesterol levels of male WT and KI mice are shown.
All data are presented as the mean ± SEM. Statistical differences were analyzed by the two-way factorial ANOVA with Tukey HSD post hoc test (A), multifactorial repeated-measures ANOVA with Tukey HSD post hoc test (B and C), Mann–Whitney test (D), and the unpaired t test (E) and are indicated by asterisks (*p < 0.05, **p < 0.01). n.s., no significance.
