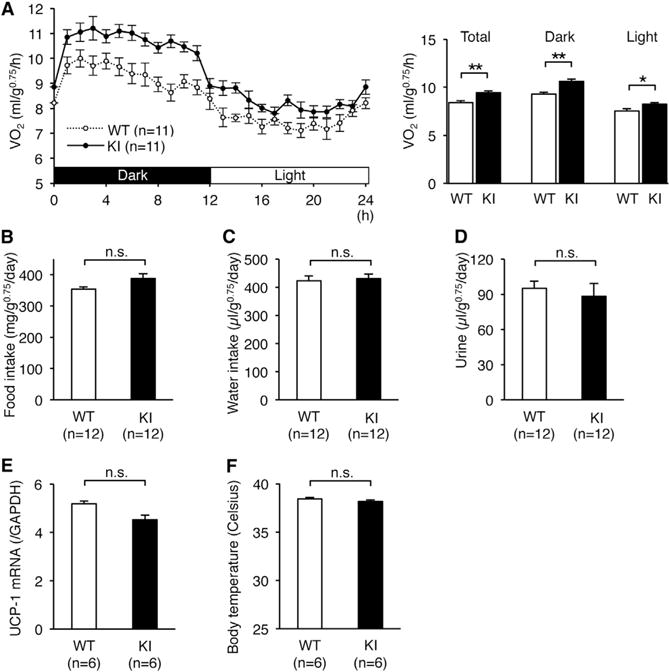
Figure 4. Increased Energy Expenditure in Edited CAPS1 KI Mice.

(A) The metabolic rates of male littermates of wild-type (WT) and homozygous KI (KI) mice were measured by oxygen uptake (VO2) during a period of 24 hr after habituation over 48 hr (left panel). Then, the metabolic rates during both the dark and light phases, as well as the total rates, were compared between the two groups (right panel). (B–F) Food intake (B), water intake (C), volume of urine (D), UCP-1 mRNA levels in brown adipose tissue (E), and body temperature (F) were compared between WT and KI mice.
All data are presented as the mean ± SEM. Statistical differences were analyzed by the unpaired t test (A–D) and Mann-Whitney test (E and F) and are indicated by asterisks (*p < 0.05, **p < 0.01). n.s., no significance.
