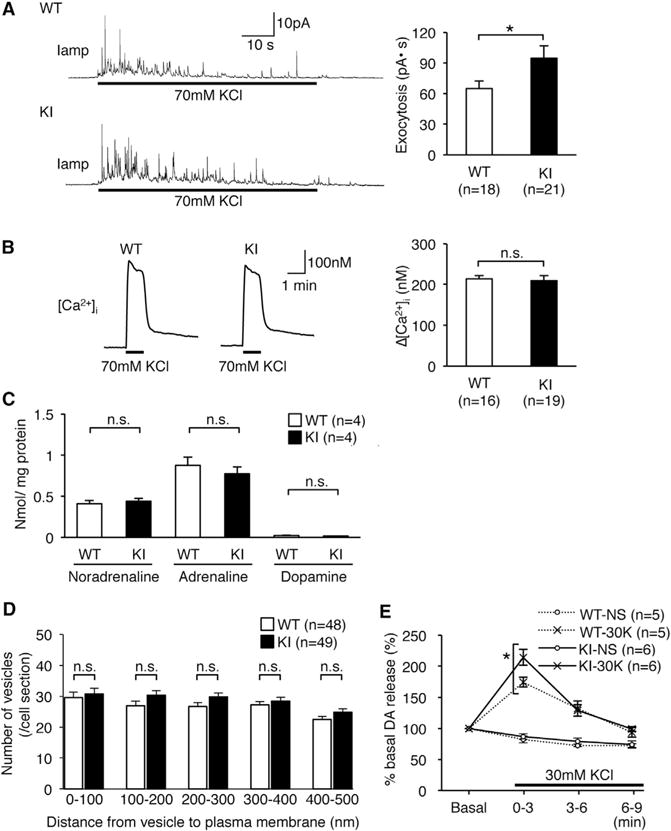
Figure 6. Increased DCV Exocytosis in Edited CAPS1 KI Mice.

(A) Representative traces of amperometric measurements from individual chromaffin cells (left panel). Exocytosis was triggered during the period indicated by the black bars. Exocytotic responses were compared between wild-type (WT) and homozygous KI (KI) mice by measuring the total area under the curve during stimulation (right panel). All data were acquired from 18 and 21 cells isolated from three mice of the WT and KI, respectively.
(B) Representative traces of the measurements of the intracellular calcium concentration from individual chromaffin cells (left panel). KCl was applied during the period indicated by the black bars. The calcium influx was compared between WT and KI mice by subtracting the basal calcium concentration from the peak (right panel). All data were acquired from 16 and 19 cells isolated from three mice of the WT and KI, respectively.
(C) The concentration of three catecholamines in adrenal glands was compared between WT and KI mice (n = 4 for each group).
(D) The distribution of whole DCVs in individual chromaffin cells as determined from the electron microscopy images (see Figure S6). All data were acquired from a total of 48 cells from five WT mice and 49 cells from five KI mice.
(E) Dopamine secretion from synaptosomes derived from the striatum was measured every 3 min after stimulation with high K+ buffer (30K) and is shown as a percentage relative to the basal release, which is set as 100%. NS, no stimulation. All data are presented as the mean ± SEM. Statistical differences were analyzed by unpaired t tests (A–D) and Mann-Whitney tests (E) and are indicated by asterisks (*p < 0.05). n.s., no significance.
