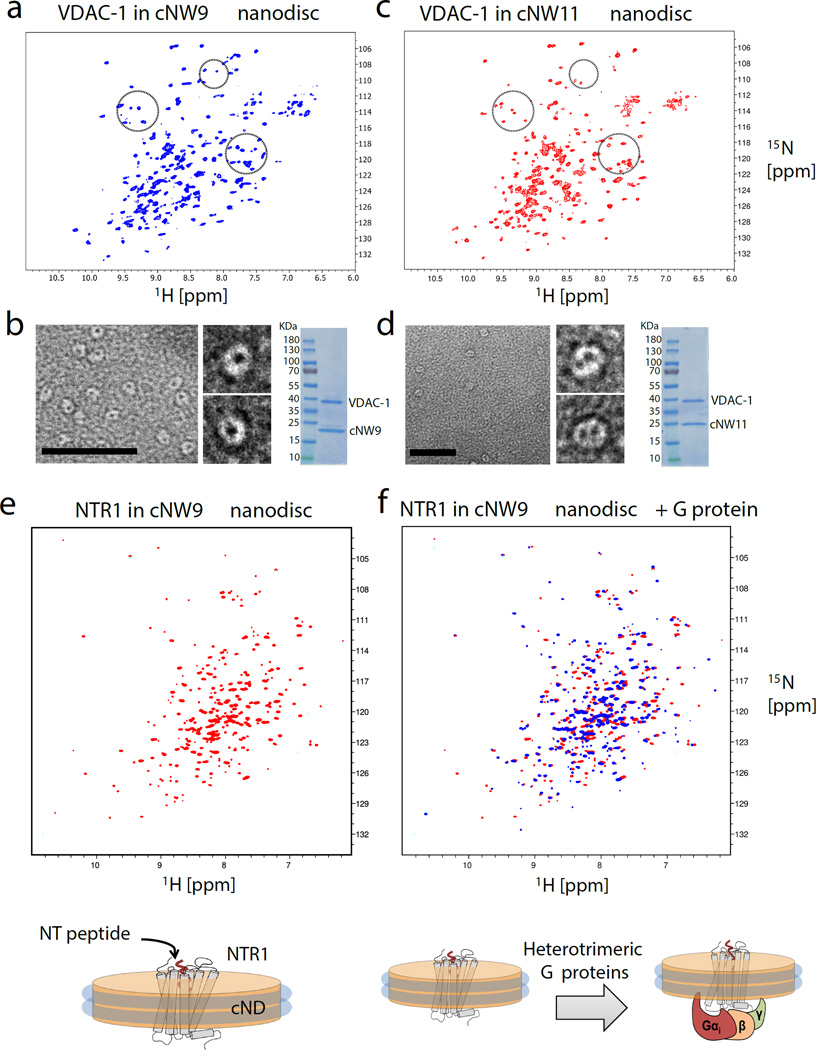
Figure 2.
Analysis of membrane proteins in different size nanodiscs. (a) 2D 1H-15N TROSY HSQC spectrum of monomeric [U-2H,15N] labeled VDAC-1 in cNW9 nanodiscs. (b) Representative image of negatively stained cNW9 nanodiscs containing single VDAC-1 channel (see also supplementary Fig. 11). The stain-filled channels appear as dark spot inside the nanodisc. Right: SDS-PAGE analysis of cNW9 nanodiscs containing VDAC-1. (c) 2D 1H-15N TROSY HSQC spectrum of dimeric [U-2H,15N] labeled VDAC-1 in cNW11 nanodiscs. (d) Representative image of negatively stained cNW11 nanodiscs containing two VDAC-1 channels. Right: SDS-PAGE analysis of cNW11 nanodiscs containing VDAC-1. (e) 1H-15N-TROSY HSQC spectrum of 40uM 15N-labeled NTR1 in cNW9 nanodisc acquired at 45°C on a Bruker 800MHz spectrometer. (f) Superimposed 1H-15N-TROSY HSQC spectra of 40uM 15N-labeled NTR1 in cNW9 nanodisc before (red) and after (blue) addition of purified heterotrimeric G protein composed of Gαi1, Gβ1, and Gγ1. The integrity of the cNW9 nanodiscs was not affected even though the G protein was added with a small amount of DDM (the final DDM concentration was less than 10% of its critical micellar concentration (CMC)). Scale bars, 50 nm (b, d).

