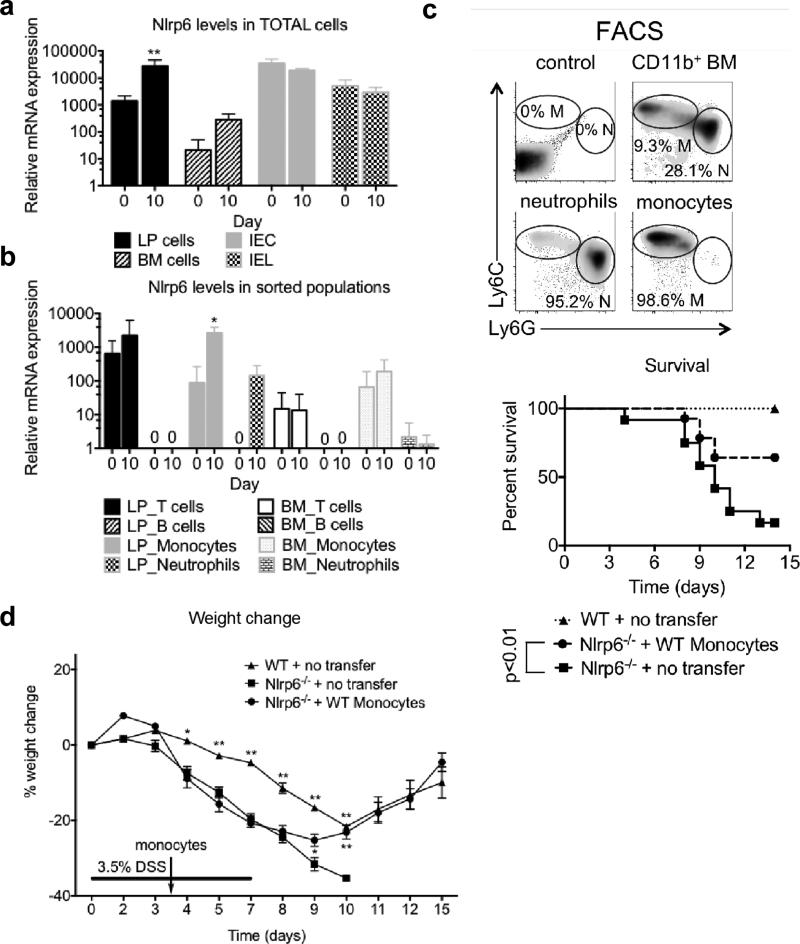
Figure 1. NLRP6 is induced in lamina propria Ly6Chi monocytes during DSS induced inflammation, and is important for reducing susceptibility to colitis.
(a) NLRP6 levels were measured in BM, LP, IECs and IELs of WT mice at day 0 and day 10 of AOM/DSS by qPCR. (b) NLRP6 expression was measured in CD3+B220− CD11b− T cells, CD3− B220+CD11b− B cells, CD3− CD11b+Ly6ChiLy6G− monocytes and CD3− CD11b+Ly6CintLy6G+ neutrophils within the BM and LP. Data are representative of three independent experiments; n=11 for day 0, n=10 for day 10. *, ** - p<0.05, p<0.001, respectively, as compared to day 0 time point of the same genotype. (c) Representative plots of Ly6C versus Ly6G staining of CD11b+ BM cells (top). Kaplan–Meyer survival curves of mice treated with 7 days of 3.5% DSS (bottom). (d) Percent weight change with 3.5% DSS administration. Data are representative of two independent experiments; n=15, n=24, n=14 for WT, Nlrp6−/− and Nlrp6−/− + WT Ly6Chi monocytes groups respectively. *, ** - p<0.05, p<0.001, respectively, as compared to Nlrp6−/−.

