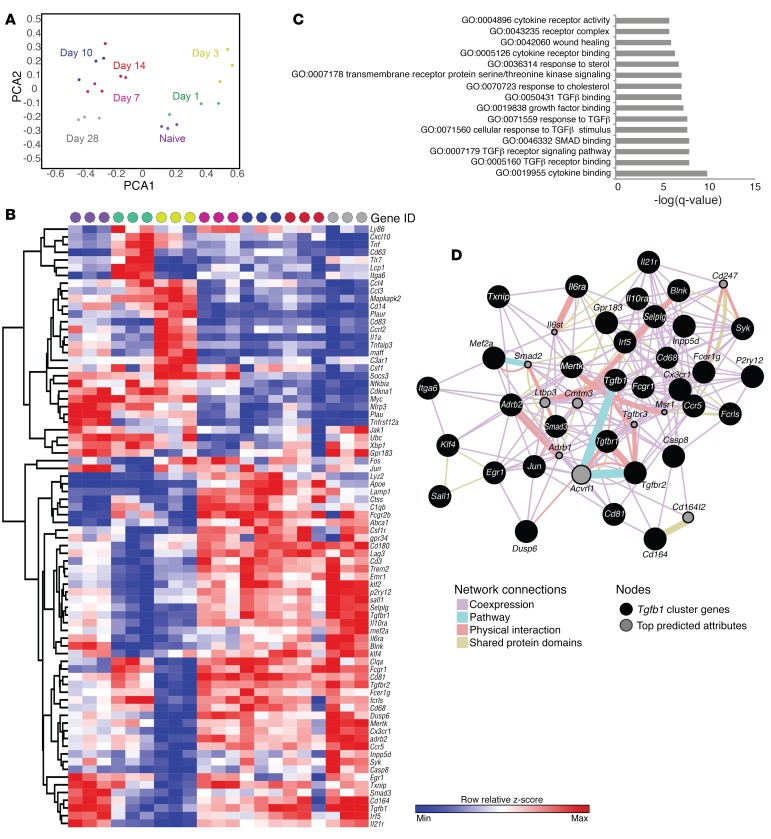
Figure 2. Temporal transcriptional analysis of microglia after ICH.
(A) Scatter plots show each sample projected on the first two principal components and are color coded according to time point. Biological replicates cluster closely at each time point. (B) Heatmap of the Z score of genes identified by PCA for each sample. Data were clustered hierarchically in GENE-E using one minus Pearson correlation and complete linkage. Data are colored according to row minimum and maximum. Time points are color coded as in A, and days 10–28 cluster most closely. Each replicate includes microglia from 3 brains, and there are 3 biological replicates per time point. (C) GO biological process enrichment analysis was performed using genes appearing in the resolution phase quadrant of the PCA. TGF-β1 pathways account for the majority of the top 15 GO functions. (D) The network diagram shows each gene identified in the resolution phase, including TGF-β1, as a node, and connections are indicated by function.

