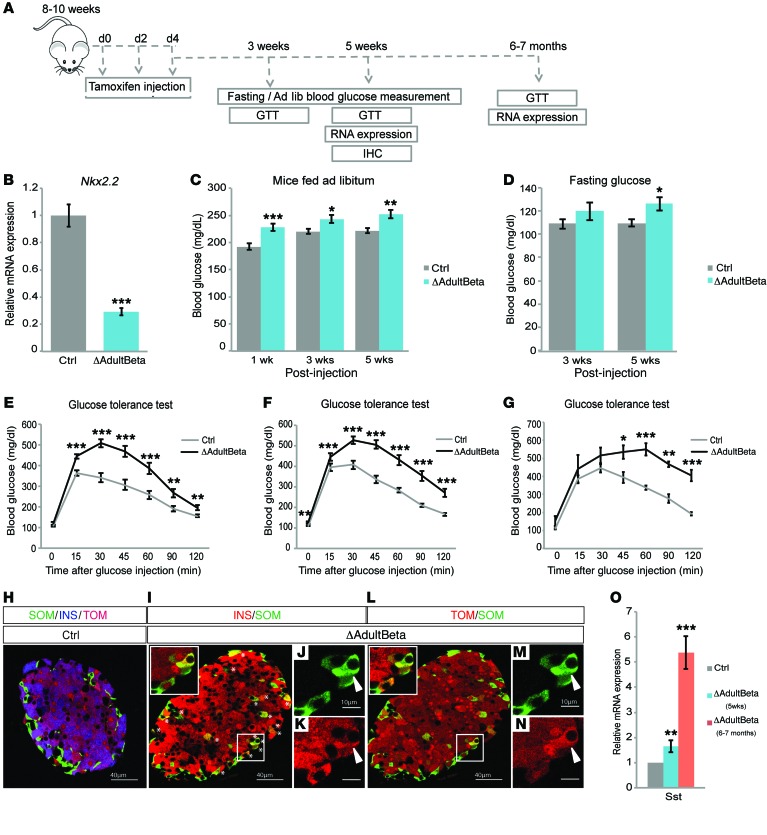
Figure 6. NKX2.2 is essential for the maintenance of β cell identity and function in adult β cells.
(A) Schematic of experimental design. (B) qRT-PCR analysis demonstrates significant deletion of Nkx2.2 in isolated islets from Nkx2.2ΔAdultBeta mice compared with controls 5 weeks after the last injection (n = 5–7). ***P ≤ 0.001; 2-tailed Student’s t test. (C) Deletion of Nkx2.2 increases ad libitum blood glucose in Nkx2.2ΔAdultBeta compared with controls starting at 1 week after the last injection (n = 16–20). *P ≤ 0.05, **P = ≤ 0.01, ***P ≤ 0.001; 2-tailed Student’s t test. (D) Fasting blood glucose levels become significantly increased 5 weeks after the last injection in Nkx2.2ΔAdultBeta compared with controls (n = 12–15). *P ≤ 0.05; 2-tailed Student’s t test. (E) Nkx2.2ΔAdultBeta mice are glucose intolerant at 3 weeks after the last injection compared with controls (n = 12–15). **P ≤ 0.01, ***P ≤ 0.001; 2-tailed Student’s t test. (F) Glucose intolerance becomes more severe 5 weeks after the last injection in Nkx2.2ΔAdultBeta compared with controls (n = 12–15). **P ≤ 0.01, ***P ≤ 0.001; 2-tailed Student’s t test. (G) Glucose intolerance continues to worsen with age; glucose tolerance test at 6–7 months after the last injection in Nkx2.2ΔAdultBeta compared with controls (n = 3–4). *P ≤ 0.05, **P ≤ 0.01, ***P ≤ 0.001; 2-tailed Student’s t test. (H–N) Immunofluorescence staining of pancreata from Nkx2.2ΔAdultBeta and control mice 5 weeks after the last injection. Insets are magnifications of selected areas indicated by white boxes showing coexpression of insulin (INS) and somatostatin (SST) (J and K) and coexpression of SST and Tomato (TOM) (M and N). The images in I–N show the same islet that was costained with insulin, somatostatin, and Tomato. The channels were separated out and false-colored to more clearly indicate coexpressed cells. qRT-PCR analysis confirms the increase in somatostatin over time in Nkx2.2ΔAdultBeta compared with controls (n = 4–6). Asterisks indicate the location of insulin/somatostatin-copositive cells. (O) qRT-PCR analysis confirms the increase in somatostatin over time in Nkx2.2ΔAdultBeta compared to controls (n = 4-6). **P ≤ 0.01, ***P ≤ 0.001; 2-tailed Student’s t test.

