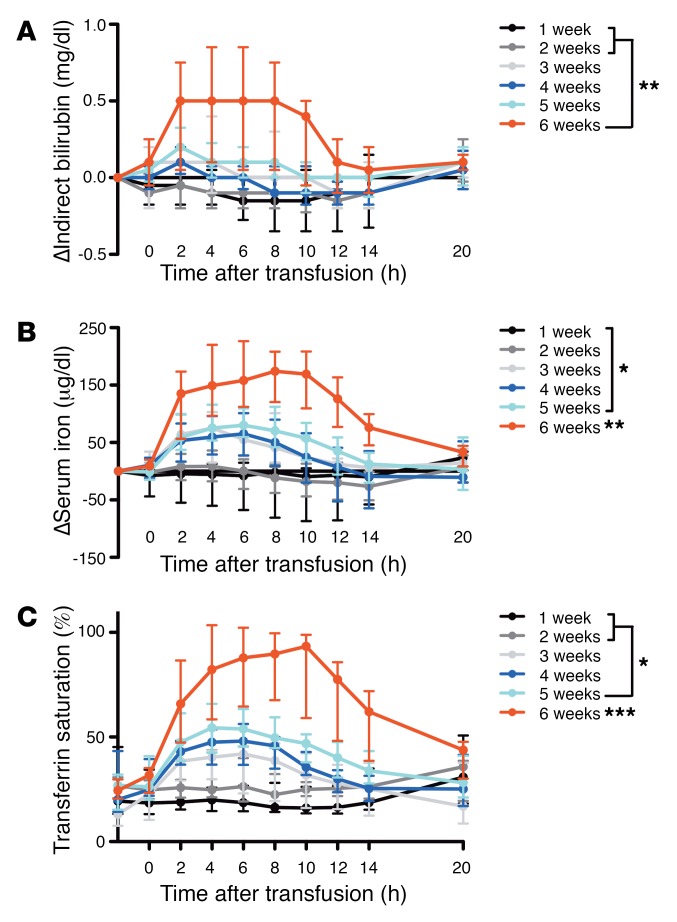
Figure 3. Markers of extravascular hemolysis are increased following transfusion of red cells stored for longer duration.
(A and B) Medians (I bars represent interquartile ranges) for the changes in indirect bilirubin and serum iron, as labeled, are shown from pretransfusion to all posttransfusion time points. (C) Median transferrin saturation is also shown from pretransfusion to all posttransfusion time points. Statistical significance for ANOVA using post-hoc Tukey’s test of the AUC among the groups is shown. n = 52 total. *P < 0.05; **P < 0.01; ***P < 0.001. Asterisks without brackets represent significance compared with all other groups.

