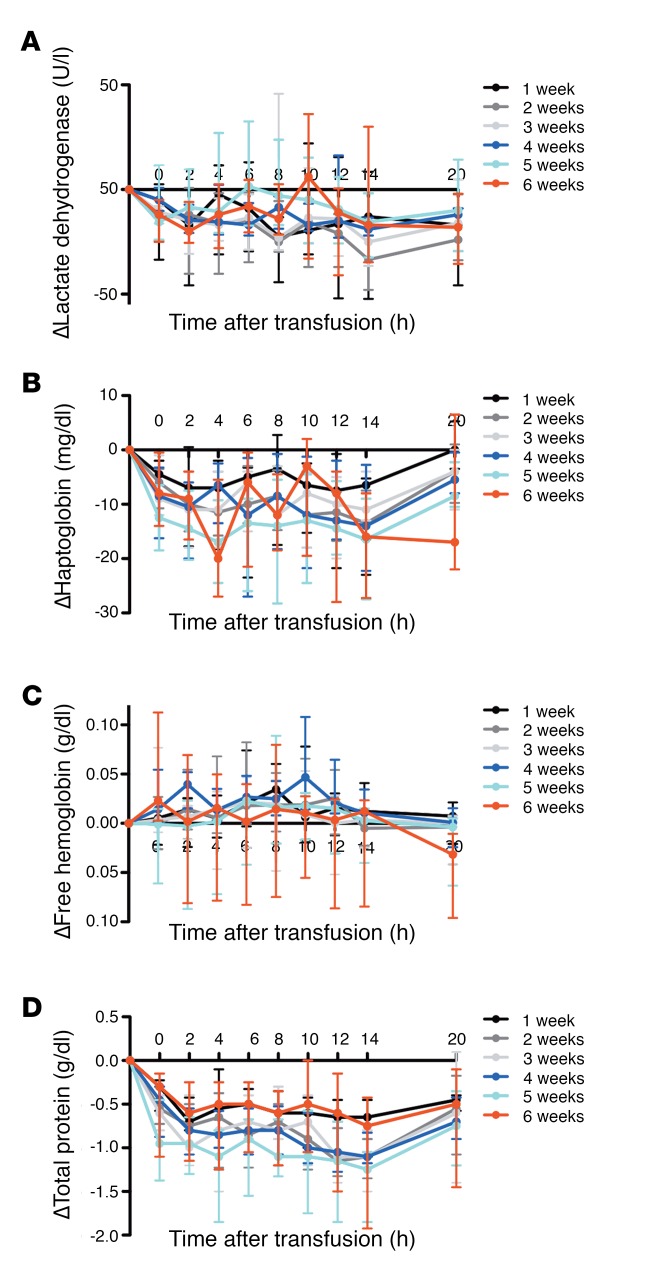
Figure 4. Markers of intravascular hemolysis are not increased following transfusion of a single, autologous red cell unit into healthy volunteers.
(A–D) Medians (I bars represent interquartile ranges) for the changes in lactate dehydrogenase, haptoglobin, plasma-free hemoglobin, and total protein are shown from pretransfusion to all posttransfusion time points, as labeled. n = 52 total.

