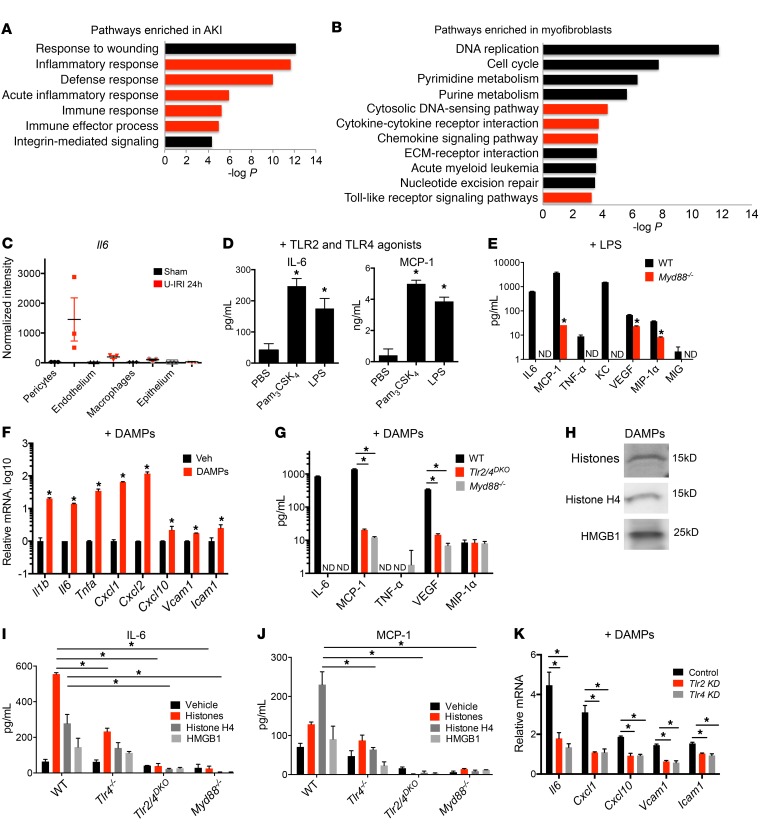
Figure 1. TLR2/4– and MyD88-dependent injury responses in pericytes.
(A and B) Enrichment analysis of biological process ontology in human biopsies from acute kidney injury (AKI) patients compared with healthy controls (A) and myofibroblasts from control and kidneys with acute injury (B). Innate immune–related pathways are highlighted in red. The x axis of the graph shows −log P values calculated using t test for the enrichment of a specific pathway. ECM, extracellular matrix. (C) RNA expression levels of Il6 in pericytes, macrophages, and epithelial and endothelial cells. Translated RNA was isolated from unilateral IRI (U-IRI) and sham control kidneys 24 hours after injury. The y axis shows normalized intensity for Il6 transcript in microarrays; n = 3 per group. (D) Cytokine concentration in supernatants from cultured pericytes 24 hours after stimulation with TLR ligands. (E) Secretion in WT or Myd88–/– pericytes 24 hours after treatment with LPS. (F) Transcriptional response of pericytes to diseased kidney DAMPs at 6 hours. (G) Cytokine concentration in supernatants of WT, Myd88–/–, or Tlr2/4DKO pericytes in response to diseased kidney DAMPs at 24 hours. (H) Western blot of kidney DAMPs. (I and J) IL-6 and MCP-1 concentration in supernatants of WT, Tlr4–/–, TLR2/4DKO, and Myd88–/– pericytes treated with either total histones, histone H4, or HMGB1 for 24 hours. (K) Effect of silencing of Tlr4 or Tlr2 on pericyte response to kidney DAMPs. (n = 3–6 per group; *P < 0.05, 1-way and 2-way ANOVA, Bonferroni’s multiple comparisons test.)

