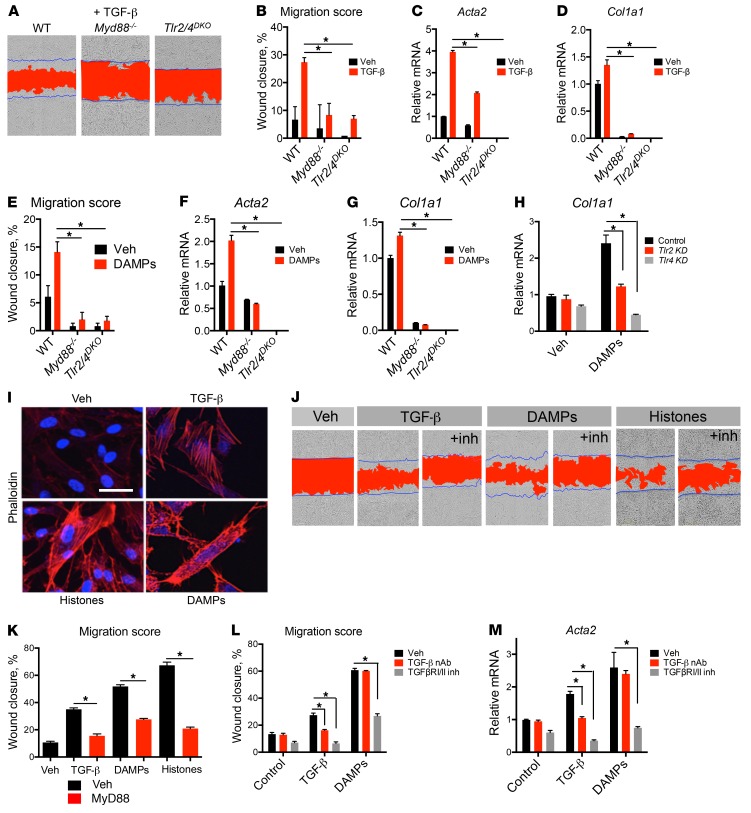
Figure 3. TLR2/4 and MyD88 control fibrogenic responses of mouse and human pericytes.
(A) Representative images showing migratory response of WT, Myd88–/–, and Tlr2/4DKO pericytes to 24-hour TGF-β treatment. Blue lines mark the boundaries of the scratch at 0 hours; red area designates scratch boundaries at 24 hours. (B) Quantification of TGF-β migration assays. (C and D) Transcription of Acta2 and Col1a1 induced by TGF-β. (E–G) Responses of WT, Myd88–/–, and Tlr2/4DKO pericytes at 24 hours to kidney DAMP treatment. (E) Quantification of migration. (F and G) Transcription of Acta2 and Col1a1. (H) Effect of Tlr2 or Tlr4 silencing with siRNA on upregulation of Col1a1 stimulated by DAMPs. (I) Stress fiber formation shown by phalloidin staining in human kidney pericytes treated with TGF-β, histones, or kidney DAMPs. (J and K) Representative images (J) and quantification (K) of migratory response of human pericytes to TGF-β, histones, or DAMPs in the presence of a MyD88 inhibitor or vehicle. (L) Quantification of migration induced by TGF-β or DAMPs in the presence or absence of TGF-β1,2,3 neutralizing antibody (NAb) or TGFRβI/II inhibitor LY2109761, 24 hours after treatment. (M) Transcription of myofibroblast marker Acta2 in response to TGF-β or DAMPs in the presence or absence of the TGFRβI/II inhibitor LY2109761, in mouse pericytes after 24-hour treatment. (Scale bar: 25 μm; n = 3–6 per group; *P < 0.05, 2-tailed Student’s t test or 2-way ANOVA, Bonferroni’s multiple comparisons test.)

