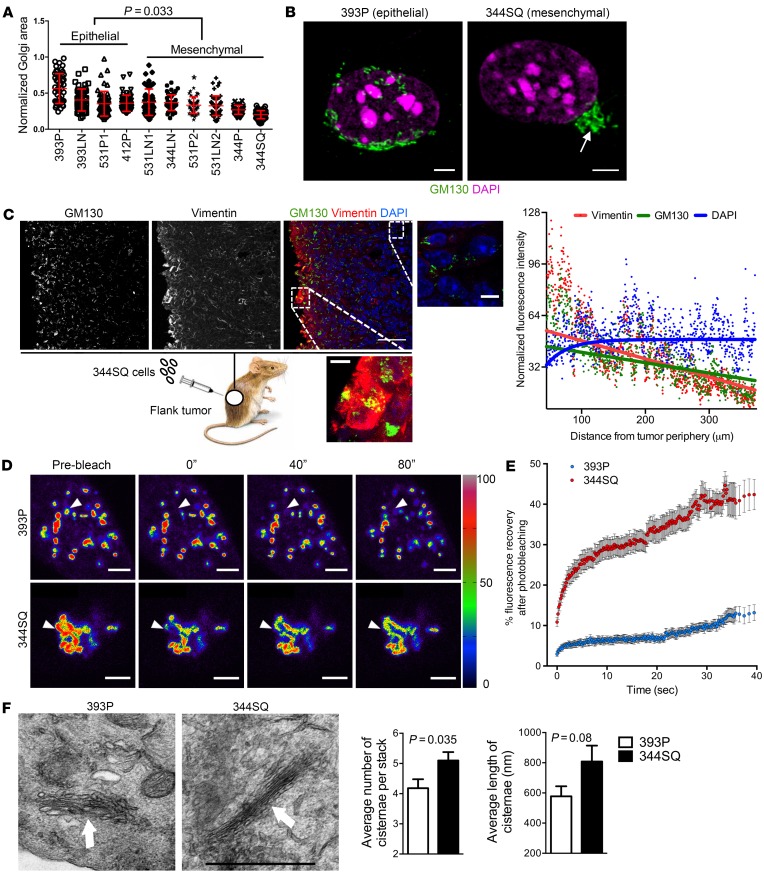
Figure 1. EMT leads to the formation of compact Golgi with improved ribbon linking and cisternal stacking.
(A) The scatter plot shows Golgi organelle areas normalized to nuclear areas in epithelial and mesenchymal KP cells. Each dot represents Golgi organelle area in a single cell. (B) Confocal micrographs of Golgi (GM130, green) and nuclei (DAPI, magenta) in representative epithelial (393P) and mesenchymal (344SQ) KP cells. A compact Golgi structure is indicated (arrow). Scale bars: 3 μm. (C) Confocal micrographs of a flank tumor formed by subcutaneous injection of 344SQ cells into a syngeneic, immunocompetent mouse. Nuclei were counterstained with DAPI (blue) and merged with GM130 (green) and vimentin (red) in an overlaid image (right); the magnified images show compact and dispersed Golgi morphologies in areas of high and low vimentin, respectively. Scale bars: 30 μm. The scatter plot to the right of the images shows normalized fluorescence intensities of cells (dots) measured radially inward from the tumor periphery. The curve fits for vimentin, GM130, and DAPI (red, green, and blue lines, respectively) were obtained from nonlinear regression using a 1-phase exponential decay equation. (D) Pseudocolored images of the Golgi enzyme GalNAcT in 344SQ cells and 393P cells at indicated time points during FRAP assays. The bleached regions of interest are indicated by arrowheads, and intensity levels are indicated by a lookup table (LUT) bar. Scale bars: 3 μm. (E) The scatter plot shows the intensity recovery profile (%) after photobleaching (n = 20 cells per group). (F) Electron micrographs of representative cisternal stacks (arrows) in 393P cells (left) and 344SQ cells (right). Scale bar: 1 μm. Bar graphs show the mean numbers of cisternae per stack (left) and cisternal lengths (right). n ≥ 10 cells per group. P values indicated (2-tailed Student’s t test). Results were replicated (n ≥ 2 experiments).

