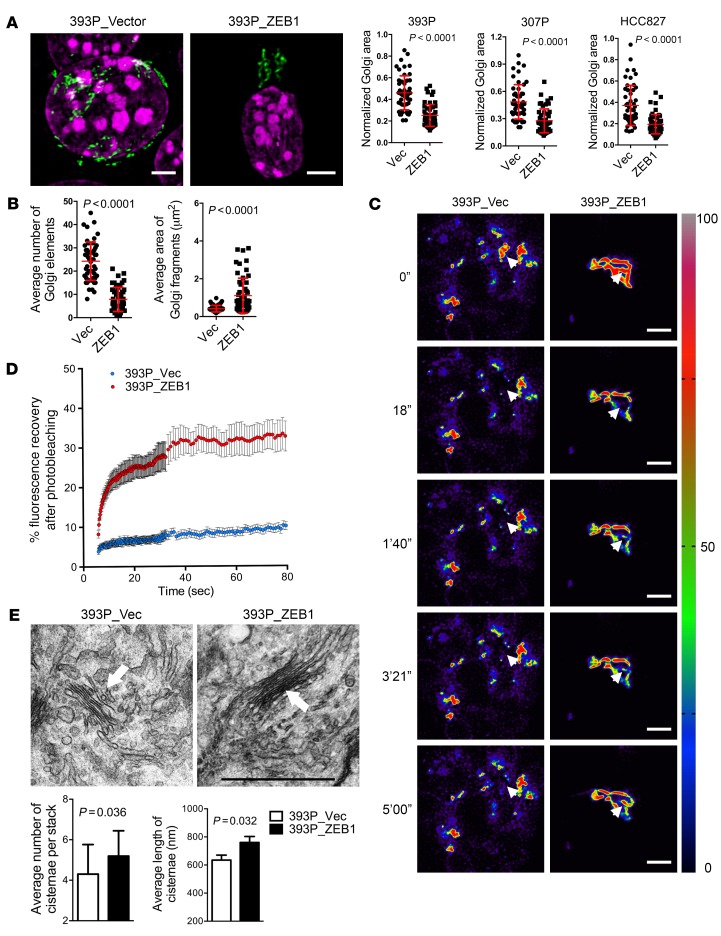
Figure 2. Ectopic ZEB1 expression increases Golgi compaction.
(A) Confocal micrographs of Golgi (GM130, green) and nuclei (DAPI, magenta) in 393P cells stably transfected with empty (Vec) or ZEB1 expression vectors. Scale bars: 3 μm. Scatter plots show the normalized Golgi areas in 393P cells (left), 307P cells (middle), and HCC827 cells (right) stably transfected with ZEB1 or empty (Vec) expression vectors. Each dot represents values from a single cell. (B) Scatter plots show the average Golgi element numbers (left) and areas (right) in 393P cells stably transfected with ZEB1 or empty (Vec) expression vectors. Each dot represents values from a single cell. (C) Pseudocolored images of FRAP assays using the Golgi enzyme GalNAcT in 393P_vector cells (left) and 393P_ZEB1 cells (right) at time points indicated to the left of each row. The bleached regions of interest are indicated by arrowheads, and intensity levels are indicated by LUT bar (right). Scale bars: 3 μm. (D) The scatter plot shows the intensity recovery profile (%) after photobleaching. n = 20 cells per group. (E) Electron micrographs of representative cisternal stacks (arrows) in 393P_vector cells (left) and 393P_ZEB1 cells (right). Scale bar: 1 μm. Bar graphs show the mean numbers of cisternae per stack (left) and cisternal lengths (right). n > 10 cells per group. P values were determined using 2-tailed Student’s t test. Results were replicated (n ≥ 2 experiments).

