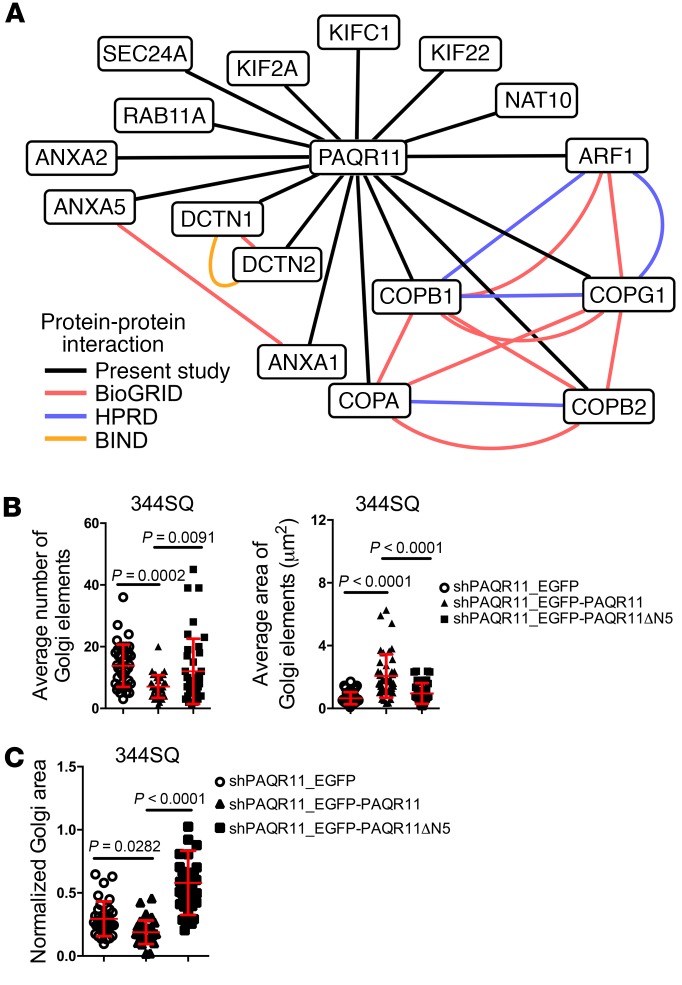
Figure 5. PAQR11 has scaffolding functions required for Golgi compaction.
(A) PAQR11-associated proteins identified by liquid chromatography–tandem mass spectrometry. Lines indicate known protein-protein interactions as shown here by pull-down assays (present study) and as reported in Biological General Repository for Interaction Data sets (BioGRID), Biomolecular Interaction Network Database (BIND), and Human Protein Reference Database (HPRD). (B) Scatter plots show the average Golgi element number (left) and areas (right) in 344SQ_shPAQR11 cells stably transfected with vectors that express EGFP alone (shPAQR11_EGFP), WT PAQR11 (shPAQR11_EGFP-PAQR11), or mutant PAQR11 that lacks amino acids 1–5 (shPAQR11_EGFP-PAQR11ΔN5). Each dot represents values from a single cell. (C) The scatter plot shows Golgi areas normalized to nuclear areas in 344SQ_shPAQR11 cells stably transfected with vectors that express EGFP alone (shPAQR11_EGFP), WT PAQR11 (shPAQR11_EGFP-PAQR11), or mutant PAQR11 that lacks amino acids 1–5 (shPAQR11_EGFP-PAQR11ΔN5). Each dot represents values from a single cell. P values were determined using 2-tailed Student’s t test or ANOVA for comparisons between 2 groups or more than 2 groups, respectively. Results in B and C were replicated (n ≥ 2 experiments).

