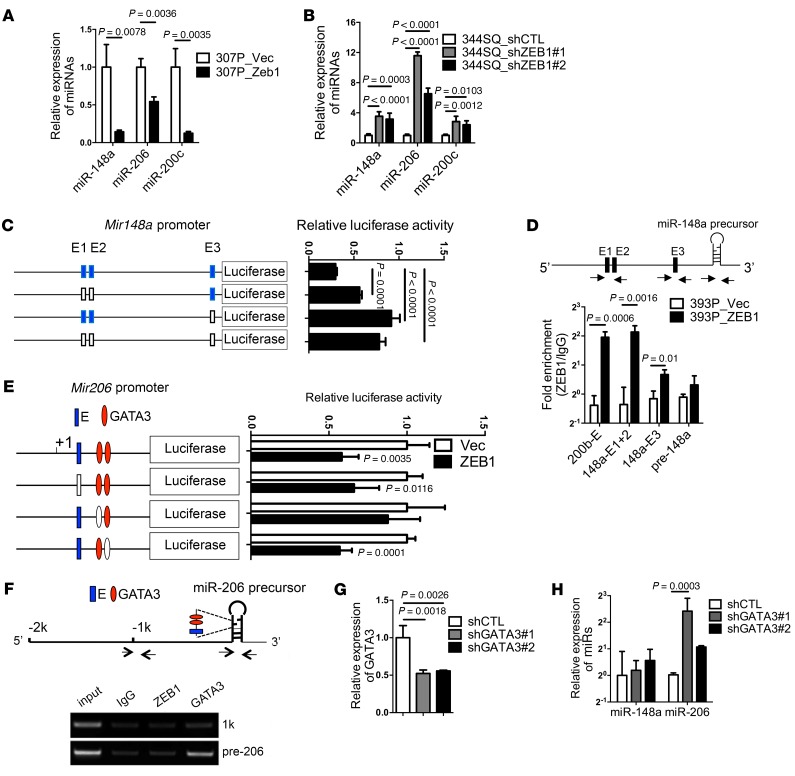
Figure 7. ZEB1 silences miR-206 and miR-148a through distinct mechanisms.
(A) qPCR analysis of miR levels expressed as a ratio (ZEB1/Vec), with 307P_vector set at 1.0. (B) The bar graph shows qPCR analysis of miR levels in 344SQ cells stably transfected with ZEB1 shRNAs (#1 or #2) or scrambled control shRNA (shCTL). Results expressed as a ratio (shZEB1/shCTL), with 344SQ_shCTL set at 1.0. (C) Reporter activities in 393P cells transiently transfected with Mir148a promoter reporters containing WT (blue) or mutated (white) E-boxes. (D) miR-148a chromatin immunoprecipitation assays on chromatin immunoprecipitated with anti-ZEB1 or IgG antibodies. PCR amplification of E1/E2 locus (148a-E1+2) or E3 locus (148a-E3) on the Mir148a promoter. Results expressed as a ratio of qPCR values (anti-ZEB1/IgG). Mir200b/c/429 locus (200b-E) and the miR-148a precursor (pre-148a) were included as positive and negative controls, respectively. Arrows indicate locations of PCR primers. (E) Reporter activities in 393P_vector cells (Vec) and 393P_ZEB1 cells (ZEB1) transiently transfected with miR-206 promoter reporters containing intact (blue or red) or mutated (white) miR binding sites. (F) miR-206 ChIP assays. Chromatin was immunoprecipitated with anti-ZEB1 (ZEB1), anti-GATA3 (GATA3), or IgG antibodies. PCR amplification of sites within the miR-206 precursor (pre-206) or a negative control region in the miR-206 promoter (1k). Arrows indicate locations of PCR primers. (G) qPCR analysis of GATA3 levels in 344SQ cells stably transfected with GATA3 shRNA (shGATA3#1 or shGATA3#2) or scrambled shRNA (shCTL). Results are expressed as a ratio (shGATA3/shCTL), with shCTL set at 1.0. (H) qPCR analysis of miR-148a levels and miR-206 levels. Results are expressed as a ratio (shGATA3/shCTL), with shCTL set at 1.0. Unless otherwise indicated, results represent the averages of triplicate samples per condition. P values determined using 2-tailed Student’s t test or ANOVA for comparisons between 2 groups or more than 2 groups, respectively. Results were replicated (n ≥ 2 experiments).

