
Figure 3. Relationship between firing rate and force for a tibialis anterior motor unit in the absence (A) and presence (B) of sural nerve stimulation.
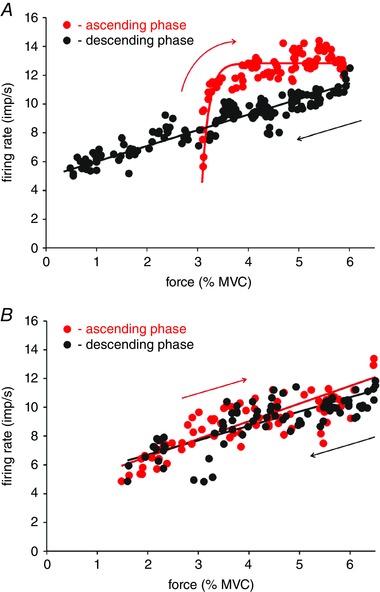
Red dots indicate firing rates during the ascending phase and black dots during the descending phase of triangular isometric force contractions. In the control condition (A), the firing rate of this unit was best fitted with a rising exponential (red trace) during the ascending phase. During the descending phase, firing rate best fitted with a linear function (black trace). With sural nerve stimulation (B), firing rate profiles for this motor unit during both ascending and descending phases were best fitted with linear functions. [Colour figure can be viewed at wileyonlinelibrary.com]