
Figure 5. Membrane force leads to a fast non‐rectifying inward current in QGP‐1 EC cell model.
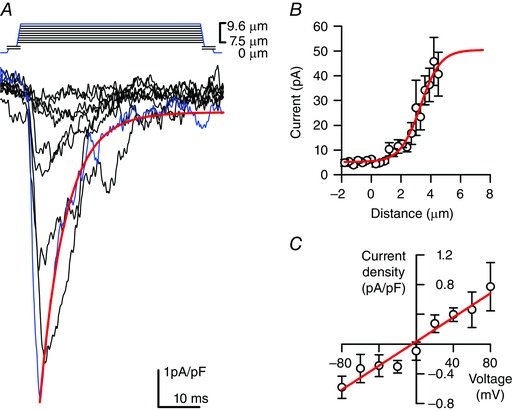
A, stepwise (0.3 μm step–1) increase in cell membrane deformation resulted in a typical set of rapidly activating and inactivating pressure induced inward currents with blue traces highlighting current in response to max deformation. Red line is a mono‐exponential fit of the blue curve (τi = 5.8 ms). B, peak current–deformation relationship (n = 8) fit by a two‐state Boltzmann function (red line) with mid‐point (x 0) 3.30 ± 0.23 μm and slope (dx) 0.67 ± 0.14 μm. C, peak current–voltage relationship (n = 3) fit by a linear function (red line) with x‐intercept of −4.1 mV.