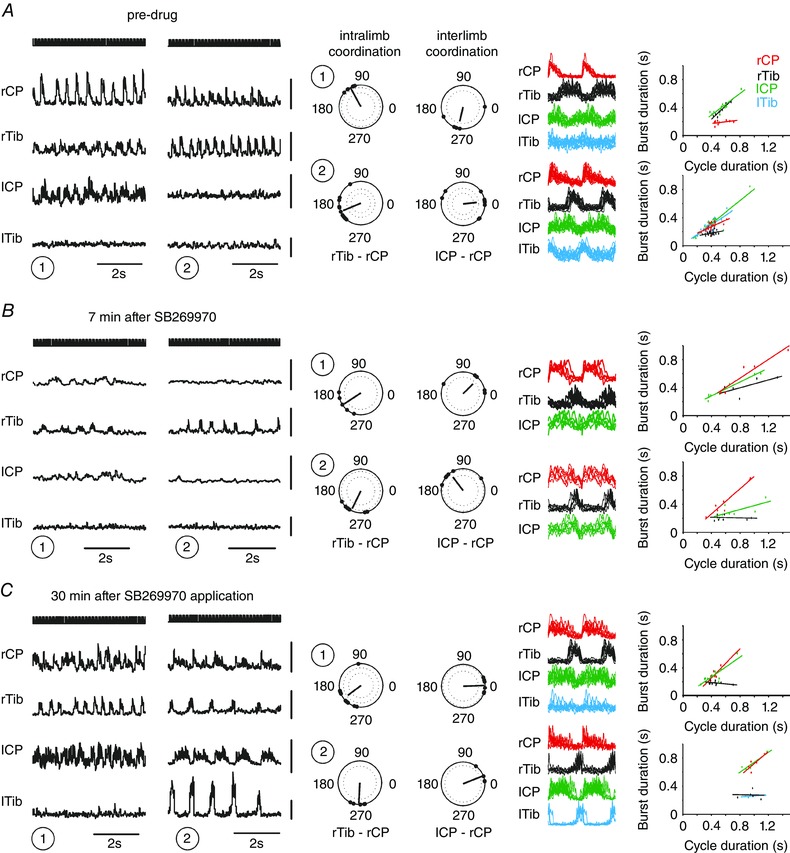
Figure 9. Synchronous interlimb coupling observed during fictive locomotion was disrupted by 5‐HT7 receptor blockade.

Different modes of locomotor activity sampled from 60 s periods of left MLR stimulation at 30 μA at a depth of 2.5 mm are illustrated (1 and 2 in A, B and C). These 60 s periods of stimulation were applied every 2–3 min and locomotion was reliably elicited in each case during the control and after recovery. Approximately 10 min after SB269970 application locomotion ceased completely, but at 7 min, later prior to cessation (1 and 2), it was possible to analyse the effect of the drug on intra‐ and interlimb coordination. During the pre‐drug condition the interlimb coordination was either chaotic (right top polar plot) or synchronous (right bottom polar plot), as shown in the polar plots and linear envelopes. Intralimb coordination was characterized by strict alternation between flexor and extensor nerves regardless of the mode of locomotor activity. The records in B show that ENG amplitude and frequency were decreased by the drug prior to complete blockade of locomotion, but intralimb coordination (polar plots) was unchanged from that during the flexor‐domination mode observed in A (2). Interlimb coordination became chaotic (right polar plots), and recovered to synchrony (C, right top polar plots). The regression lines show rhythms that are symmetrical, extensor dominated, and flexor domination, without any clear effect of 5‐HT7 receptor blockade on these modes of activity. Dots on the polar plots show the timing of each lCP burst onset after the onset of activity in rCP in interlimb coordination analysis and the timing of each rTib burst onset after the onset of activity in rCP in intralimb coordination analysis. The dark lines represent the average vector, with the strength of the relationship shown as the length of the vector. The dotted lines in polar plots show the P < 0.001 (outer circle) and P < 0.05 (inner circle) significance levels of the r vector using a critical Rayleigh's value calculated for a given P value. Plots with only one dotted circle represent only P < 0.05. Linear envelopes show overlays of the rectified and filtered bursts during each period (rCP, red; rTib, black; lCP, green; lTib, blue) plotted in relation to the onset of rCP activity. The colour of the regression lines is coded according to the colour of the linear envelopes. Abbreviations: lCP/rCP, left/right common peroneal nerve; lTib/rTib, left/right tibial nerve; lCP‐rCP, polar plot analysis of interlimb coordination between burst activity recorded in both (left and right) common peroneal nerves; rTib‐rCP, polar plot analysis of intralimb coordination between burst activity recorded in right tibial and right common peroneal nerve.
