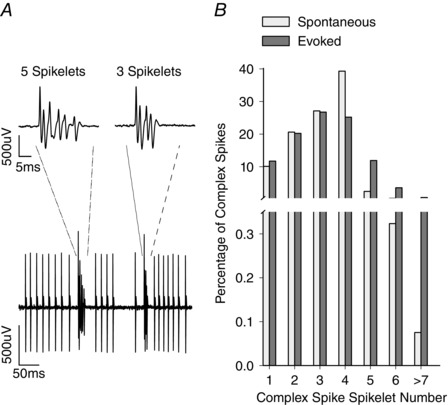
Figure 1. Purkinje cell and spikelet number.

A, example recording from a Purkinje cell showing complex spikes and simple spikes. Two complex spikes are shown with different spikelet numbers occurring close in time. The two complex spikes, representing complex spikes with five and three spikelets, are shown at an expanded time base in the insets. B, distribution of spikelet number for spontaneous (white bars) and evoked (grey bars) complex spikes from n = 61 and n = 27 Purkinje cells, respectively.
